April 5, 2012 (The Editor’s Desk is updated each business day.)
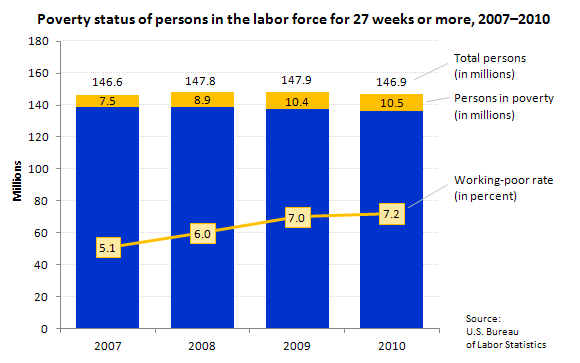
"Working poor" rate 7.2 percent in 2010
In 2010, there were 10.5 million individuals classified as "working poor" (persons who spent at least 27 weeks in the labor force—that is, working or looking for work—but whose incomes still fell below the official poverty level); the number of working poor was little changed from 2009.
[Chart data]
The working-poor rate—the ratio of the working poor to all individuals in the labor force for at least 27 weeks—was 7.2 percent, also little different from the previous year's figure (7.0 percent).
[Chart data]
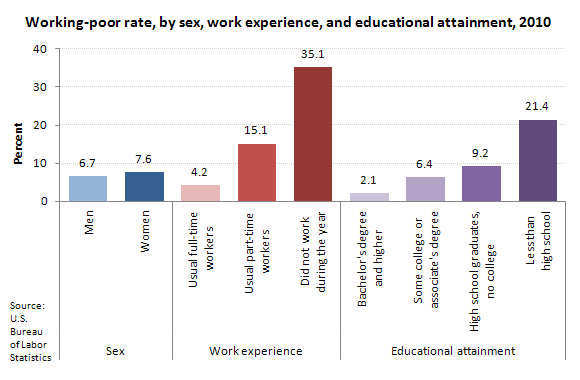
Among those who were in the labor force for 27 weeks or more in 2010, about the same number of men (5.3 million) and women (5.2 million) were classified as working poor. The working-poor rate, however, continued to be higher for women (7.6 percent) than for men (6.7 percent) in 2010.
There were 4.8 million workers who lived below the poverty threshold and usually worked full time in 2010. Full-time workers were less likely to be among the working poor than were part-time workers. Among persons in the labor force for 27 weeks or more, 4.2 percent of those usually employed full time were classified as working poor, compared with 15.1 percent of part-time workers.
The likelihood of being classified as working poor greatly diminishes as workers attain higher levels of education. Only about 1.0 million college graduates were classified as working poor in 2010, compared with 2.9 million workers with less than a high school diploma and 3.9 million workers who were high school graduates with no college. Among college graduates, 2.1 percent of those who were in the labor force for at least 27 weeks were classified as working poor, compared with 21.4 percent of those with less than a high school diploma and 9.2 percent of those workers who were high school graduates with no college.
These data are from the Current Population Survey. To learn more, see "A Profile of the Working Poor, 2010" (PDF), BLS Report 1035, March 2012. These data were collected in the 2011 Annual Social and Economic Supplement to the Current Population Survey.
Related TED articles
Earnings and wages | Employment | Labor force | Men | Unemployment | Women
Of interest
Spotlight on Statistics: National Hispanic Heritage Month
In this Spotlight, we take a look at the Hispanic labor force—including labor force participation, employment and unemployment, educational attainment, geographic location, country of birth, earnings, consumer expenditures, time use, workplace injuries, and employment projections.
Read more »