By State
Medicaid Enrollment by State
- Alabama
- Alaska
- Arizona
- Arkansas
- Texas
- California
- Colorado
- New York
- Connecticut
- Florida
- Georgia
- Hawaii
- Idaho
- Illinois
- Indiana
- Iowa
- Kansas
- Kentucky
- Louisiana
- Maine
- Virginia
- Maryland
- Delaware
- Massachusetts
- Michigan
- Minnesota
- mississippi
- Missouri
- Montana
- Nebraska
- Nevada
- New Hampshire
- New Jersey
- New Mexico
- North Carolina
- North Dakota
- Ohio
- Ohio
- Oregon
- Pennsylvania
- Rhode Island
- South Carolina
- South Dakota
- Tennessee
- Tennessee
- Vermont
- Washington
- West Virginia
- Wisconsin
- Wyoming
- District of Columbia
- Maryland
- Delaware
- New Jersey
- Connecticut
- Rhode Island
- Massachusetts
- New Hampshire
- Vermont
Medicaid Enrollees, USA, FY2006-2010
Medicaid Paid, USA, FY2006-2010 |
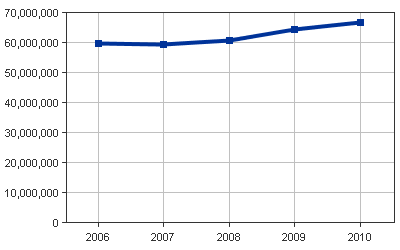
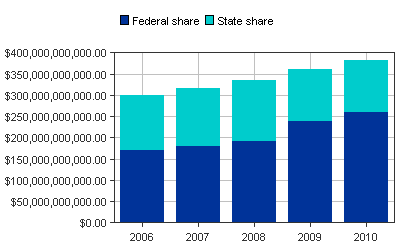
Medicaid Enrollments and Payments, USA, FY 2006-2010 | |||||||
| Year | Population * | Enrollment Count | Total Medicaid Paid | Federal Share Paid | States Share Paid | ||
| 2010 ** | 309,050,816 | 66,695,156 | $383,495,367,018.00 | $259,975,106,338.00 (67.79%) | $123,520,260,680.00 (32.21%) | ||
| 2009 | 307,006,550 | 64,524,878 | $360,316,252,069.00 | $238,886,908,406.00 (66.30%) | $121,429,343,663.00 (33.70%) | ||
| 2008 | 304,374,846 | 60,867,440 | $334,204,851,522.00 | $190,606,119,724.00 (57.03%) | $143,598,731,798.00 (42.97%) | ||
| 2007 | 301,579,895 | 59,415,222 | $315,955,305,789.00 | $180,109,293,325.00 (57.00%) | $135,846,012,464.00 (43.00%) | ||
| 2006 | 298,593,212 | 59,928,867 | $299,021,981,879.00 | $170,551,691,476.00 (57.04%) | $128,470,290,403.00 (42.96%) | ||
Notes:
- Data sources: Medicaid Statistical Information System (MSIS) and Medicaid Financial Management Report.
- Reports are based on federal fiscal year, not calendar year basis. (Oct. 1 - Sept. 30)
- Enrollment counts include all ever enrolled, with or without Medicaid services rendered during the fiscal year.
- FY2009 enrollment counts for MA, UT and WI are projected using the average enrollment change rate between FY2006-2008.
- ** All FY2010 enrollment counts except for AK, AL, AR, CT, DE, IN, KY, LA, MS, NE, NJ, NM, OH, OR, SD, TN are projected using average enrollment change rate between FY2007-2009.
- State and local administrative expenses, CHIP expenses are not included.
- * Population data are from US Census Bureau (June, 2010)