| Geography |
 Back to Top Back to Top |
-
On December 1, 2008, SPP added a new municipal member, Lincoln Electric System (LES); and two new state agencies, Nebraska Public Power District (NPPD) and Omaha Public Power District (OPPD).
States covered: Kansas, Oklahoma, most of Nebraska, and parts of New Mexico, Texas, Louisiana, Missouri, Mississippi and Arkansas
Reliability region: Southwest Power Pool (SPP)
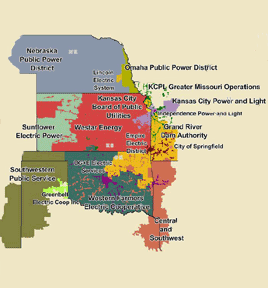
Balancing authorities: Balancing authorities are responsible for managing the minute-to-minute supply/demand balance for electricity within their borders to assure reliability. The SPP regional footprint is comprised of 16 balancing authorities:
| CSWS - (AEPW) American Electric Power West* | CLEC - CLECO Power |
|---|---|
| EDE - Empire District Electric | GRDA - Grand River Dam Authority |
| INDN - Independence Power & Light | KACY - Kansas City Board of Public Utilities |
| KCPL - Kansas City Power & Light | LAFA - City of Lafayette, Louisiana |
| LEPA - Louisiana Energy & Power Authority | MPS - KCP&L Greater Missouri Operations |
| OKGE - OG+E Electric Services | SECI - Sunflower Electric |
| SPA - Southwestern Power Administration | SPS - Southwestern Public Service |
| WR - Westar Energy | WFEC - Western Farmers Electric Coop |
There are five different SPP footprints: Regional Entity, Reserve Sharing Group, Reliability Coordinator (RC) Area, Regional Transmission Organization/Tariff, EIS Market Region. More information regarding these footprints is available at: SPP Footprints
| RTO/ISO |
 Back to Top Back to Top |
-
Southwest Power Pool (SPP) (granted RTO status in 2004) provides transmission service on the transmission facilities owned by its members and operates the region's real-time energy imbalance service (EIS) market. Market participants trade physical electricity bilaterally, either directly or through brokers, and through the EIS market.
Southwest Power Pool 2008 State of the Markets Report
Market Monitor:
Richard Dillon - Director, Market Development & Analysis
Boston Pacific Company, Inc. - External Market Advisor
| Generation/Supply |
 Back to Top Back to Top |
-
Marginal fuel type: Natural gas (55%) and coal (35%)
Firm generating capacity - summer 2008: 50,600 MW
Capacity reserve - summer 2008: 7,709 MW
Reserve margin - summer 2008: 18%
| Demand |
 Back to Top Back to Top |
-
Regional Footprint Peak Demand for 2008: 42,891 MW, reached in August.
Peak Demand Growth 2007-2008: 0.7%
All time peak demand:
-
Reliability Footprint: 43.3 GW (set August 14, 2007)
Market Footprint: 35.9 GW (set August 14, 2007)
In the summer of 2007 demand reached record levels due to extremely hot weather.
| 2005 | 2006 | 2007 | 2008 | |
|---|---|---|---|---|
| Summer Peak Demand (GW) | 40.5 | 42.2 | 43.3 | 42.9 |
| Source: Derived from SPP Data | ||||
| Prices |
 Back to Top Back to Top |
-
Annual Average of Platts Daily Spot Price Index
SPP North
2004: $45.19/MWh
2005: $67.44/MWh
2006: $55.84/MWh
2007: $60.21/MWh
2008: $68.77/MWh


