to the National Atlas Home page
About | Fact Sheets | Contact Us | Partners | Products | Site Map | FAQ | Help | Follow us on Twitter 
AgricultureBiologyBoundariesClimateEnvironmentGeologyGovernmentHistoryMappingPeopleTransportationWater
to the Interactive Map MakerMap LayersPrintable MapsWall MapsDynamic MapsArticlesMapping Professionals
 

Dynamic Maps

 
  Dynamic Map Icon
Nationalatlas.gov™ contains a remarkable range of products and services to meet the diverse needs of people who are looking for maps and geographic information about America. Dynamic maps are innovative illustrations of geographic phenomena. We combine the science of mapping with today's multimedia to offer maps that are useful, understandable, and that stimulate interactivity.
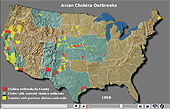
 
     
  Wildlife Mortality - Avian Cholera
 
Link to Wildlife Mortality - Avian Cholera  dynamic map. View dynamic Map.

Shockwave required

Directions -
Click the small map to the left to view the dynamic map.  A new window will open containing the Wildlife Mortality - Avian Cholera dynamic map. 

To explore this map, move your cursor over the States highlighted in green.  Red areas indicate counties where outbreaks of avian cholera have occurred during that specific year.  Move your cursor over these to view the State and county name in the window on the control bar. For each year only States with current outbreaks are shown.  Counties with previous avian cholera outbreaks are shown in yellow.

To change years use these tools on the control bar:

slider button - click and drag to change years
loop button - to play a continuous loop
stop button - to stop the loop
start/continue button - to start/continue
step back button - to step back
step forward button - to step forward
link to information button - link to information

Biology
Map Maker
Wildlife Mortality: Avian Cholera
Map Layer
Dynamic Map
 
Related Links

back to top