to the National Atlas Home page
About | Fact Sheets | Contact Us | Partners | Products | Site Map | FAQ | Help | Follow us on Twitter 
AgricultureBiologyBoundariesClimateEnvironmentGeologyGovernmentHistoryMappingPeopleTransportationWater
to the Interactive Map MakerMap LayersPrintable MapsWall MapsDynamic MapsArticlesMapping Professionals
 

Dynamic Maps

 
  Dynamic Map Icon
Nationalatlas.gov™ contains a remarkable range of products and services to meet the diverse needs of people who are looking for maps and geographic information about America. Dynamic maps are innovative illustrations of geographic phenomena. We combine the science of mapping with today's multimedia to offer maps that are useful, understandable, and that stimulate interactivity.
 
     
  Vegetation Growth in the United States
 

down arrowLower 48
down arrowAlaska
down arrowInformation
down arrowRelated Links

Biology
Map Maker
Forest Cover Types
Vegetation Growth - Average: 2004
Vegetation Growth - Peak: 2004
Map Layer
Forest Cover Types
Vegetation Growth - Average
Vegetation Growth - Peak

Mapping
Articles
What is AVHRR?
 
Directions - Move the cursor over the month tabs to see the vegetation growth values for that month. Move the cursor over the 2005 tab to watch the progression of vegetation growth during the year.
Lower 48 - 2005
vegetation growth for the lower 48 states 2005 tab December tab December tab November tab November tab October tab October tab September tab September tab September tab August tab August tab July tab July tab June tab June tab May tab May tab April tab April tab April tab March tab March tab February tab February tab January tab January tab
back to topup arrow
Alaska - 2005
tabs showing  vegetation growth by month
vegetation growth for Alaska
2005 tab October tab September tab September tab August tab August tab July tab July tab June tab June tab June tab May tab May tab April tab April tab
Click here to view 2004 maps.
back to topup arrow
Information

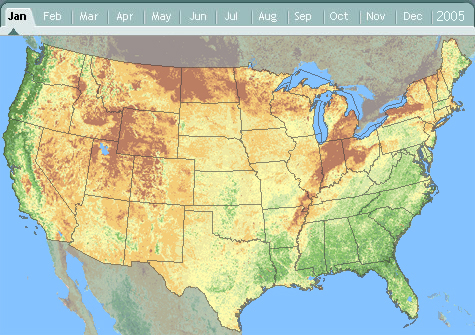
These Advanced Very High Resolution Radiometer (AVHRR) images are collected by the National Oceanic and Atmospheric Agency's polar-orbiting Television Infrared Observation Satellites (NOAA-11 and NOAA-12). The images have been received, processed, and distributed by the U.S. Geological Survey since 1987. The spatial or ground resolution of the AVHRR data is 1.1 kilometers. The AVHRR sensor acquires data in a wide swath (approximately 2,400 kilometers), enabling it to create an image of the entire surface of the Earth each day. The NOAA-12 satellite acquires data in early morning and the NOAA-11 satellite in early afternoon.

Because the AVHRR sensor observes all of the Earth's surface each day, the likelihood that one or more cloud-free observation of the surface (over a period of days) is increased. When all of the observations (images) for a month are combined, using a selection criteria that selects clear sky observations, nearly cloud free images can be created.

A vegetation index (the Normalized-Difference Vegetation Index) is calculated from to these images, which represents the quantity and vigor (photosynthesis activity) of the vegetation. The equation for the vegetation index makes it relatively easy to distinguish green vegetation from non-vegetated areas such as water, barren land, ice, snow, and clouds.

With this ability, changes in surface processes over short periods, such as growing seasons, can be monitored.

back to topup arrow
Related Links
back to topup arrow