to the National Atlas Home page
About | Fact Sheets | Contact Us | Partners | Products | Site Map | FAQ | Help | Follow us on Twitter 
AgricultureBiologyBoundariesClimateEnvironmentGeologyGovernmentHistoryMappingPeopleTransportationWater
to the Interactive Map MakerMap LayersPrintable MapsWall MapsDynamic MapsArticlesMapping Professionals


Water
Map Maker
Realtime Streamflow Stations
Map Layer
Realtime Streamflow Stations
 

Article

  Realtime Streamflow Stations
downUses of Streamflow Data
downData Collection Process
downDischarge Graph Explanation
downGage Height Graph Explanation
downUsing the National Atlas to Get Streamflow Information


The USGS, in cooperation with more than 800 state, local and other federal agencies, operates approximately 7,000 continuously active streamflow measurement and data collection sites, called streamgages. Almost 5,000 of the USGS's approximately 7,000 streamgages are equipped with telemetry that transmits a reading of stream depth ("stage") to a district office via satellite or telephone. This "realtime" data is used for a multiplicity of purposes: including flood hazard mitigation by the National Weather Service, the U.S. Army Corps of Engineers, and the Federal Emergency Management Agency; and for resource planning, and infrastructure design of reservoirs and dams.

  Stream-gaging station at Coldwater Lake, Washington
 L. Topinka, U.S. Geological Survey
 

The data typically are updated every 4 hours, but this can vary depending upon the equipment used and the flow status -- more frequent updates may be made in times of flooding. Real-time hydrologic data are considered provisional data. Please be aware of the limitations this imposes.

The National Atlas online interactive Map Maker includes the current map of the streamgages equipped with telemetry, which are referred to as realtime streamflow stations. The map usually is regenerated every business day. A "robot" program examines each of the web servers that serve realtime data, compiles a list of realtime stations, and uses the list to regenerate the realtime map. The Map Maker Identify tool will link to an interactive site to let you plot a graph of flow versus time, called a hydrograph.

  back to top
  Uses of Streamflow Data
 
  • Enhancing public safety by providing data for forecasting and managing floods
  • Allocating water for municipal, industrial and irrigation uses
  • Scheduling power production
  • Delineating and managing flood plains
  • Advising recreational users of likely conditions to be found on streams
  • Characterizing current water-quality conditions
  • Determining input rates of various pollutants into lakes, reservoirs, or estuaries
  • Understanding the biological effects of contamination
  • Setting permit requirements for discharge of treated wastewater
  • Computing the loads of sediment and chemical constituents
  • Operating and designing multipurpose reservoirs
  • Designing highway bridges and culverts
  • Developing or operating recreation facilities
  • Designing, operating, and maintaining navigation facilities
  • Setting minimum flow requirements for meeting aquatic life goals
  • Monitoring compliance with minimum flow requirements
  back to top
  Data Collection Process
 

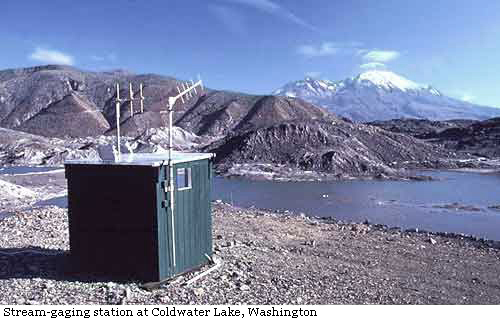
The basic piece of data obtained at a station is the stage, which is the height of the water surface above a reference elevation. If the stage of the streambed is known and is subtracted from the water surface stage, then the result is the depth of water in the stream. Although stage of a stream is useful in itself in planning uses of flood plains, most users of streamflow data need to know the discharge of the stream. Discharge is defined as the volume of flow passing a specified point in a given interval of time and includes the volume of the water and any sediment or other solids that may be dissolved or mixed with the water. The units of discharge usually are measured in cubic feet per second. Stage can be measured continuously with automatic sensors, but discharge can be directly measured only by on-site observers. Using a relation between stage and discharge, discharge is derived from the stage data. The stage and discharge relation for a specific stream location is defined from periodic discharge measurements made at known stages.

  Schematic of a stilling well and shelter at a stream-gaging station
 

Measuring Discharge
The most practical method of measuring the discharge of a stream is through the velocity area method. This method requires the physical measurement of the cross sectional area and the velocity of the flowing water. Discharge is determined as the product of the area times the velocity. Velocity is measured by using a current meter. The meter consists of a propeller that is rotated by the action of flowing water. Given the number of revolutions in a given time interval, velocity can be determined for the location of the current meter.

Automatic Data Dissemination
Many streamflow data users must make operational decisions daily. For these users, streamflow records are computed and made available on a provisional basis. A reading of stream depth (stage) is transmitted to a district office via satellite or telephone. Computers in the district office convert the depth reading to a value for flow and plot a graph of flow versus time, usually showing the previous 7 days. Some stations also transmit values for temperature, conductance, or other parameters.

By using telemetry, data are transmitted around the clock by means of two geostationary operations environmental satellites (GOES) that are positioned above the Equator over the eastern Pacific Ocean and Brazil. These data then are retransmitted by means of a domestic satellite, and the resulting signal is received by the USGS and other users. The transmission and receipt of the signals are automated, as are the provisional discharge computations that are available for meeting current data needs. The data literally come "from the stream to your screen".

  back to top
  Discharge Graph Explanation
 

Below is a hydrograph. This a graph showing variation of stage, discharge, velocity, or other properties of water with respect to time. The information on the graph is from a device called a gage which measures water features such as surface elevation.

  Discharge hydrograph Discharge Unique identification number Dates Cubic foot per second Median daily streamflow Years of record Optional data values
 

1. Discharge - The volume of water (and anything mixed with the water) passing a specific point at a given interval of time. Streamflow is the discharge that occurs in a natural channel, such as in a surface stream. back to discharge hydrograph

2. Unique identification number - Identifies a particular site, in downstream order, on a stream, canal, lake, or reservoir, where long-term, systematic observation of hydrologic data are obtained. back to discharge hydrograph

3. Dates - The data from 4,200 stations typically are transmitted at intervals of 3 or 4 hours by an earth-satellite-based communications system. Those data are referred to as "realtime", and are record over the given dates on the chart with the most recent stream measurement time identified with the data. back to discharge hydrograph

4. Cubic foot per second - The rate of streamflow representing a volume of 1 cubic foot passing a given point during 1 second. A cubic foot per second is equivalent to 7.48 gallons per second or 448.8 gallons per minute or 0.646 million gallons per day. Abbreviated as ft3/s or CFS. One cubic foot equals 0.0283 cubic meters.back to discharge hydrograph

5. Median Daily Streamflow - Takes the arithmetic daily mean value (all measurements on a given day [one per "bump"], then divide by the number of measurements) and calculates the mean of those values for the same date over a given period of years. For example, total all daily mean values for every Jan. 21 records over the years of record, then divided by the years of record (48 in this case). back to discharge hydrograph

6. Years of record - Number of years data was collected. Variations in continuity or type of data collected at each site are described under "period of record" and "gage" below each specific streamflow site link. back to discharge hydrograph

7. Optional data values - Depending on season or flow conditions, additional data lines may be shown such as: 90% flow - The low flow that is exceeded 90% of the time for the days in the period of record. Flood stage - The water level where flooding may begin, as determined by the National Weather Service. back to discharge hydrograph

  back to top
  Gage Height Graph Explanation
  Gage height hydrograph Gage height Unique identification number Dates
 

1. Gage height - The water-surface elevation above some arbitrary gage datum is called gage height. This is often used interchangeably with the more general term "stage", although gage height is more appropriate when used with a reading on a gage. back to discharge hydrograph

2. Unique identification number - Identifies a particular site, in downstream order, on a stream, canal, lake, or reservoir, where long-term, systematic observation of hydrologic data are obtained.back to discharge hydrograph

3. Dates - The data from 4,200 stations typically are transmitted at intervals of 3 or 4 hours by an earth-satellite-based communications system. Those data are referred to as "realtime", and are record over the given dates on the chart with the most recent stream measurement time identified with the data.back to discharge hydrograph

  back to top
  Using the National Atlas to Get Streamflow Information
 

You can use the National Atlas to check today's flow conditions for a stream near you. More than 4,000 locations are included in the Realtime Streamflow Stations map layer. You might use this service to check the current flow of your favorite recreational stream or to find up-to-date information on flood conditions. For more uses see the section - Uses of Streamflow Data. Here are the steps for identifying realtime streamflow stations.

  • Go to the National Atlas Map Maker.


  • In the Map Layers frame on the right, click the Watersymbol or the word Water to open the Water theme


  • Next, turn on the Realtime Streamflow Station map layer by clicking in the box next to the map layer name Realtime Streamflow Stations


  • Use either Zoom to State or the Zoom In function to go to the location where you want information


  • Click the Identify button and center the cursor over a realtime streamflow station (a red dot) and click


  • In a pop-up window, the Identify results are displayed

To get the current conditions at the realtime streamflow station, click on the hyperlinked station name and ID. This will open a new page that includes current and historic stage, discharge, and velocity information and other properties of water with respect to time.

  back to top