About This Report
Introduction
Older Americans 2012: Key Indicators of Well-Being (Older Americans 2012) is the sixth in a series of reports by the Federal Interagency Forum on Aging-Related Statistics (Forum) describing the overall condition of the U.S. population age 65 and over. The reports use data from over a dozen national data sources to construct broad indicators of well-being for the older population and to monitor changes in these indicators over time. By following these data trends, the reports make more information available to target efforts to improve the lives of older Americans.
The Forum hopes that this report will stimulate discussions by policymakers and the public, encourage exchanges between the data and policy communities, and foster improvements in Federal data collection on older Americans. By examining a broad range of indicators, researchers, policymakers, service providers, and the Federal government can better understand the areas of well-being that are improving for older Americans and the areas of well-being that require more attention and effort.
Structure of the Report
Older Americans 2012, by presenting data in a nontechnical, user-friendly format, complements other more technical and comprehensive reports produced by the individual Forum agencies. The report includes 37 indicators that are grouped into five sections: Population, Economics, Health Status, Health Risks and Behaviors, and Health Care.
There is also a special feature on end-of-life issues. A list of the indicators included in this report is located in the Table of Contents.
Each indicator includes the following:
- An introductory paragraph that describes the relevance of the indicator to the well-being of the older population.
- One or more charts that graphically describes important aspects of the data.
- Bulleted highlights of salient findings from the data and other sources.
The data used to develop the indicators are presented in table format in the back matter of
the report. Data source descriptions and a glossary are also provided in the back matter of the report.
Selection Criteria for Indicators
Older Americans 2012 presents 37 key indicators of critical aspects of older people’s lives. The Forum chose these indicators because they meet the following criteria:
- Easy to understand by a wide range of audiences.
- Based on reliable, nationwide data sponsored, collected, or disseminated by the Federal government.
- Objectively based on substantial research that connects the indicator to the well-being of older Americans.
- Balanced so that no single section dominates the report.
- Measured periodically (but not necessarily annually) so that they can be updated as appropriate and permit description of trends over time.
- Representative of large segments of the aging population, rather than one particular group.
Considerations When Examining the Indicators
The data in Older Americans 2012 usually describe the U.S. population age 65 and over. Mutually exclusive and exhaustive age groups (e.g., age 65–74, 75–84, and 85 and over) are reported whenever possible.
Data availability and analytical relevance may affect the specific age groups that are included for an indicator. For example, because of small sample sizes in some surveys, statistically reliable data for the population age 85 and over often are not available. Conversely, data from the population younger than age 65 sometimes are included if they are relevant to the interpretation of the indicator. For example, in “Indicator 11: Participation in the Labor Force,” a comparison with a younger population enhances the interpretation of the labor force trends among people age 65 and over.
To standardize the age distribution of the age 65 and over population across years, some estimates have been age adjusted by multiplying age-specific rates by time-constant weights. If an indicator has been age adjusted, it will be stated in the note under the chart(s) as well as under the corresponding table(s).
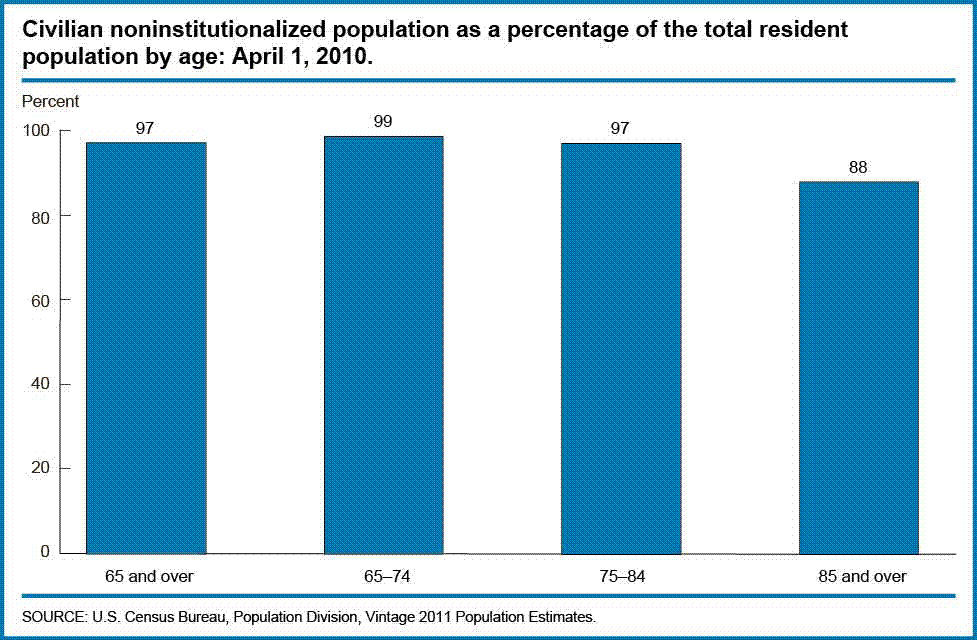
The reference population (the base population sampled at the time of data collection) for each indicator is clearly labeled under each chart and table and defined in the glossary. Whenever possible, the indicators include data on the U.S. resident population (both people living in the community and people living in institutions). However, some indicators show data only for the civilian noninstitutionalized population. Because the older population residing in nursing homes (and other long-term care institutional settings) is excluded from samples based on the noninstitutionalized population, caution should be exercised when attempting to generalize the findings from these data sources to the entire population age 65 and over. This is especially true for the older age groups. For example, in 2010, 12 percent of the population age 85 and over was not included in the civilian noninstitutionalized population as defined by the U.S. Census Bureau.
Survey Years
In the charts, tick marks along the x-axis indicate years for which data are available. The range of years presented in each chart varies because data availability is not uniform across the data sources. To standardize the time frames across the indicators, a timeline has been placed at the bottom of each indicator that reports data for more than one year.

Accuracy of the Estimates
Most estimates in this report are based on a sample of the population and are therefore subject to sampling error. Standard tests of statistical significance have been used to determine whether differences between populations exist at generally accepted levels of confidence or whether they occurred by chance. Unless otherwise noted, only differences that are statistically significant at the 0.05 level are discussed in the text. To indicate the reliability of the estimates, standard errors for selected estimates in the chartbook can be found on the Forum’s Web site at http://www.agingstats.gov.
Finally, the data in some indicators may not sum to totals because of rounding.
Sources of Data
The data used to create the charts are provided in tables in the back of the report. The tables also contain data that are described in the bullets below each chart. The source of the data for each indicator is noted below the chart.
Descriptions of the data sources can be found in the back of the report. Additional information about these data sources is available on the Forum’s Web site at http://www.agingstats.gov. For those who wish to access the survey data used in this chartbook, contact information is given for each of the data sources.
Occasionally, data from other publications are included to give a more complete explanation of the indicator. The citations for these sources are included in the “References” section.
Data Needs
Because Older Americans 2012 is a collaborative effort of many Federal agencies, a comprehensive array of data was available for inclusion in this report. However, even with all of the data available, there are still areas where scant data exist. Although the indicators that were chosen cover a broad range of components that affect well-being, there are other issues that the Forum would like to address in the future. These issues are identified in the “Data Needs” section.
Mission
The Forum’s mission is to encourage cooperation and collaboration among Federal agencies to improve the quality and utility of data on the aging population.
The specific goals of the Forum are:
- Widening access to information on the aging population through periodic publications and other means.
- Promoting communication among data producers, researchers, and public policy- makers.
- Coordinating the development and use of statistical databases among Federal agencies.
- Identifying information gaps and data inconsistencies.
- Investigating questions of data quality.
- Encouraging cross-national research and data collection on the aging population.
- Addressing concerns regarding collection, access, and dissemination of data.
More Information
If you would like more information about Older Americans 2012 or other Forum activities, contact:
Traci Cook
Staff Director
Federal Interagency Forum on Aging-Related Statistics
3311 Toledo Road, Room 7108
Hyattsville, MD 20782
Phone: (301) 458-4082
Fax: (301) 458-4021
E-mail: agingforum@cdc.gov
Web site:
http://www.agingstats.gov
Older Americans on the Internet
Supporting material for this report can be found at http://www.agingstats.gov. The Web site contains the following:
- Data for all of the indicators in Excel spreadsheets (with standard errors, when available).
- Data source descriptions.
- PowerPoint slides of the charts.
The Forum’s Web site also provides:
- Ongoing Federal data resources relevant to the study of the aging.
- Links to aging-related statistical information on Forum member Web sites.
- Other Forum publications (including Data Sources on Older Americans 2009).
- Workshop presentations, papers, and reports.
- Agency contacts.
- Subject area contact list for Federal statistics.
- Information about the Forum.
Additional Online Resources
Administration on Aging
Statistics on the Aging Population
http://aoa.gov/AoARoot/Aging_Statistics/index.aspx
A Profile of Older Americans
http://aoa.gov/AoARoot/Aging_Statistics/Profile/index.aspx
Online Statistical Data on the Aging
http://aoa.gov/AoARoot/Aging_Statistics/Census_Population/census1990/Introduction.aspx
Agency for Healthcare Research and Quality
AHRQ Data and Surveys
http://www.ahrq.gov/data
Bureau of Labor Statistics
Bureau of Labor Statistics Data
http://www.stats.bls.gov/data
U.S. Census Bureau
Statistical Abstract of the United States
http://www.census.gov/compendia/statab
Age Data
http://www.census.gov/population/www/socdemo/age.html
Longitudinal Employer-Household Dynamics
http://lehd.did.census.gov/led/
Centers for Medicare and Medicaid Services
CMS Research, Statistics, Data, and Systems
http://www.cms.hhs.gov/Research-Statistics-Data-and-Systems/Research-Statistics-Data-and-Systems.html
Department of Housing and Urban Development
Policy Development and Research Information Services
http://www.huduser.org/
Department of Veterans Affairs
Veteran Data and Information
http://www1.va.gov/vetdata
Employee Benefit Security Administration
EBSA’s Research
http://www.dol.gov/ebsa/publications/research.html
Environmental Protection Agency
Aging Initiative
http://www.epa.gov/aging
Information Resources
http://www.epa.gov/aging/resources/index.htm
National Center for Health Statistics
Health Data Interactive
http://www.cdc.gov/nchs/hdi.htm
Longitudinal Studies of Aging
http://www.cdc.gov/nchs/lsoa.htm
Health, United States
http://www.cdc.gov/nchs/hus.htm
National Institute on Aging
NIA Centers on the Demography of Aging
http://www.agingcenters.org/
National Archive of Computerized Data on Aging
http://www.icpsr.umich.edu/NACDA
Publicly Available Datasets for Aging-Related Secondary Analysis
http://www.nia.nih.gov/researchinformation/scientificresources
Office of the Assistant Secretary for Planning and Evaluation, HHS
Office of Disability, Aging, and Long-Term Care Policy
http://www.aspe.hhs.gov/_/office_specific/daltcp.cfm
Office of Management and Budget
Federal Committee on Statistical Methodology
http://www.fcsm.gov
Social Security Administration
Social Security Administration Statistical Information
http://www.ssa.gov/policy
Substance Abuse and Mental Health Services Administration
Center for Behavioral Health Statistics and Quality
http://www.samhsa.gov/data
Center for Mental Health Services
http://www.mentalhealth.samhsa.gov/cmhs/MentalHealthStatistics
Other Resources
FedStats.gov