Goal
Promote the health of people with disabilities, prevent secondary conditions, and eliminate disparities between people with and without disabilities in the U.S. population.
Because disability status has been traditionally equated
with health status, the health and well-being of people with disabilities has
been addressed primarily in a medical care, rehabilitation, and long-term care
financing context. Four main misconceptions emerge from this contextual
approach: (1) all people with disabilities automatically have poor health, (2)
public health should focus only on preventing disabling conditions, (3) a
standard definition of “disability” or “people with disabilities” is not needed
for public health purposes, and (4) the environment plays no role in the
disabling process. These misconceptions have led to an underemphasis of health
promotion and disease prevention activities targeting people with disabilities
and an increase in the occurrence of secondary conditions (medical, social,
emotional, family, or community problems that a person with a primary disabling
condition likely experiences).
Challenging these misconceptions will help to clarify the
health status of people with disabilities and address the environmental
barriers that undermine their health, well-being, and participation in life
activities. A broad array of health promotion activities are relevant to all
people experiencing a disability, whether they are categorized by racial or
ethnic group, gender, and primary conditions or diagnoses, such as major
depression, cerebral palsy, diabetes, spinal cord injury, or fetal alcohol
syndrome. The similarities among people with disabilities are as important as
or more important than the differences among clinical diagnostic groups.
Caregiver issues also have been considered, as well as environmental barriers.
Environmental factors affect the health and well-being of people with disabilities
in many ways. For example, weather can hamper wheelchair mobility, medical
offices and equipment may not be accessible, and shelters or fitness centers
may not be staffed or equipped for people with disabilities. Compliance with
the Americans with Disabilities Act (ADA) would help overcome some of these
barriers. A crosscutting goal is to eliminate disparities with the nondisabled
population.
The International Classification of Functioning and
Disability (ICIDH-2), developed by the World Health Organization (WHO) with
the input of numerous nations—including the United States—provides uniform
language and a framework for describing functioning, health, and disability
status among all people.[1] This framework
clarifies definitional issues and includes environmental factors.
An estimated 54 million persons in the United States, or
nearly 20 percent of the population, currently live with disabilities.[2] Data for the period 1970 to 1994 suggest
that the proportion is increasing.[3] The increase in
disability among all age groups indicates a growing need for public health
programs serving people with disabilities.
From 1990 to 1994, disability rates increased among youth
under age 18 years.3
There was a 33 percent increase in activity limitations among girls, from 4.2
percent to 5.6 percent, and a 40 percent increase in activity limitations among
boys, from 5.6 percent to 7.9 percent.
Among adults aged 18 to 44 years, there was a 16 percent
increase in activity limitations, from 8.8 percent in 1990 to 10.3 percent in
1994.3
This increase suggests that 3.1 million more people aged 18 to 44 years were
limited in 1994 than in 1990.
The absolute number of adults aged 65 years and older with
disabilities increased from 26.9 million in 1982 to 34.1 million in 1996. Because the total number of adults aged 65
years and older increased even faster, the proportion of those with
disabilities declined from 24.9 percent in 1982 to 21.3 percent in 1994.3
However, the rise in numbers indicates a growing need for programs and services
to serve this older population.
The direct medical and indirect annual costs associated with
disability are more than $300 billion, or 4 percent of the gross domestic product.[4]
This total cost includes $160 billion in medical care expenditures (1994
dollars) and lost productivity costs approaching $155 billion.
The health promotion and disease prevention needs of people
with disabilities are not nullified because they are born with an impairing
condition or have experienced a disease or injury that has long-term
consequences.[5] People with
disabilities have increased health concerns and susceptibility to secondary
conditions. Having a long-term condition increases the need for health
promotion that can be medical, physical, social, emotional, or societal.
People who have activity limitations report having had more
days of pain, depression, anxiety, and sleeplessness and fewer days of vitality
during the previous month than people not reporting activity limitations.[6]
Increased emotional distress, however, does not arise directly from the
person’s limitations. The distress is likely to stem from encounters with
environmental barriers that reduce the individual’s ability to participate in
life activities and that undermine physical and emotional health. In view of
the increased rates of disability among youth, it is particularly important to
target activities and services that address all aspects of health and
well-being, including promoting health, preventing secondary conditions, and
removing environmental barriers, as well as providing access to medical care.
For an older person with a disability, it is important to target worsening
coexisting conditions that may intensify and thus threaten general well-being.
For example, declining vision combined with declining hearing can greatly
impair mobility, nutrition, and fitness.[7]
Disability can be viewed as a universal phenomenon everyone
experiences at some time.[8]
Disability also can be viewed as representing a minority of the population, in
that people with disabilities may be less visible, undercounted, and underserved.[9]
As a potentially underserved group, people with disabilities would be expected
to experience disadvantages in health and well-being compared with the general
population. People with disabilities may experience lack of access to health
services and medical care and may be considered at increased risk for various
conditions.
Few data systems identify people with disabilities as a subpopulation.
Disparities need to be identified to plan appropriate public health programs.
Despite the paucity of data, some disparities between people with and without
disabilities have been noted. These disparities include excess weight, reduced
physical activity, increased stress, and less frequent mammograms for women
over age 55 years with disabilities.[10]
Health promotion programs that focus on improving
functioning across a spectrum of diagnoses and a range of age groups are
effective in reducing secondary conditions and outpatient physician visits
among people with disabilities.[11], [12],
[13]
For example, a focus on improving muscle tone, flexibility, and strength can accrue
benefits for mobility-impaired people in wheelchairs and mobility-impaired
people with arthritis.[14]
For people with communication disabilities and disorders, interventions can
improve access to health-enhancement programs. People with sight impairments
can have access to readable job applications, food labels, and medications.
People with hearing impairments can have access to televised or videotaped
exercise programs that are captioned or signed by interpreters depicted within
an inset of a video screen. Often, the most effective interventions may be environmental
rather than medical.
Many health promotion interventions already in place for the
population at large may be easily adapted to the needs of people with
disabilities. New strategies can be influenced by results from studies that
describe risk factors for secondary conditions or protective factors against
additional impairments. For example, the number of cases of secondary
osteoporosis among able-bodied women and their range of bone mineral density
deficits can be estimated by using existing Federal data sets. The degree to
which women exercise and ingest calcium or estrogen supplements also can be
estimated, leading to measurements of the influence of both risk and protective
factors associated with osteoporosis in the able-bodied population. Because
women with mobility impairments experience an elevated risk for secondary
osteoporosis at earlier ages, their risk factors, including diminished bone
mineral density, and their potential protective factors, including optimal
calcium or estrogen supplementation and types of exercise, become critically
important epidemiologic parameters.[15], [16] The results of investigations of secondary osteoporosis
already influence health promotion strategies among able-bodied women. Similar
investigations can augment the development of health promotion strategies among
women with disabilities.
Current guidelines provide opportunity to design health
promotion interventions targeting people with disabilities that accommodate
ongoing evidence-based evaluation[17]
and demonstrate cost-effectiveness.[18], [19] For example, clinical interventions that focus on
appropriate and timely medical care can be equally accessible for people with
and without disabilities. Mammography screening is recommended every 1 to 2
years, with or without an annual clinical breast examination, for able-bodied
women aged 50 to 69 years.[20]
This recommendation also can be adapted for women with disabilities. Clinical
providers, however, must first recognize the reasons women with disabilities
often refrain from seeking mammography services, such as the lack of adaptive
equipment on mammography screening machines or unfamiliarity with the
needs of people with disabilities expressed by clinicians. Counseling to
prevent injuries among all adults also is recommended. For example, men and
women with disabilities, especially those with skeletal insufficiencies or
calcium deficits, are at increased risk for fractures. Adding bone mineral
screening and fitness counseling during clinical encounters may be beneficial
in preventing injuries. In these ways, evidence-based health promotion and
disease prevention programs can be developed, implemented, and evaluated to
target the health and injury disparities between people with and without
disabilities.
Health promotion interventions for people with
disabilities—in the community, clinical settings, or elsewhere—should include
culturally and linguistically appropriate elements.
Healthy People 2000 did not have a chapter specifically establishing
health objectives for people with disabilities. However, some objectives
targeted people with disabilities, including leisure-time physical activity,
use of community support programs by people with severe mental disorders,
treatment for depression, activity limitations associated with chronic
conditions and back conditions, and receipt of recommended clinical preventive
services. A progress review held in January 1997 showed that none of these
specific objectives relevant to people with disabilities had been met,10
and parity with the nondisabled population will continue to be monitored.
People with disabilities reporting no leisure-time physical
activity declined from the 1985 baseline of 35 percent to 29 percent in 1995,
short of the target of 20 percent for 2000. In addition, the review noted
several disparities: 40 percent of people with disabilities aged 20 years and
older reported being overweight compared with 35 percent of the general
population and short of the goal of 25 percent; 49 percent of people aged 18
years and older with disabilities reported adverse health effects from stress
compared with 34 percent of the general population; and clinical preventive
services showed disparities for data on tetanus boosters (56 percent versus 59
percent for the general population), Pap tests (69 percent versus 77 percent of
women aged 18 years and over in 1994), and breast exams and mammograms (50
percent versus 56 percent for women aged 50 years and over).
Note: Unless otherwise
noted, data are from the Centers for Disease Control and Prevention, National Center for Health Statistics, Healthy People 2000
Review, 1998–99.
Disability and Secondary Conditions
Goal: Promote the health of people with disabilities,
prevent secondary conditions, and eliminate disparities between people with and
without disabilities in the U.S. population.
|
Number
|
Objective Short Title
|
|
6-1
|
Standard definition of people with
disabilities in data sets
|
|
6-2
|
Feelings and depression among
children with disabilities
|
|
6-3
|
Feelings and depression interfering
with activities among adults with disabilities
|
|
6-4
|
Social participation among adults
with disabilities
|
|
6-5
|
Sufficient emotional support among
adults with disabilities
|
|
6-6
|
Satisfaction with life among adults
with disabilities
|
|
6-7
|
Congregate care of children and
adults with disabilities
|
|
6-8
|
Employment parity
|
|
6-9
|
Inclusion of children and youth with
disabilities in regular education
programs
|
|
6-10
|
Accessibility of health and wellness
programs
|
|
6-11
|
Assistive devices and technology
|
|
6-12
|
Environmental barriers affecting
participation in activities
|
|
6-13
|
Surveillance and health promotion
programs
|
Target: 100
percent.
Baseline: No
Healthy People 2010 surveillance instruments include a standard set of
questions that identify people with disabilities in 1999.
Target setting
method: Total coverage.
Data source:
CDC, NCEH.
The call for statistics on people with disabilities is
longstanding and increasing. Various Federal agencies have attempted to collect
these data in several research areas.[21] Two separate issues exist regarding
data collection: (1) using different operational definitions of disability and
(2) not collecting information from people with disabilities during surveys.
None of the federally funded surveys attempting to collect data on people with
disabilities is using the same definition of disability. This lack of
standardization has made it difficult to (1) identify and include individuals
with a disability, (2) measure the nature and extent of disability in the
United States, (3) assess the impact of various disabilities on the person’s
ability to participate in society, (4) assess the extent of secondary
conditions among people with disabilities, and (5) identify environmental
barriers to participation and risk factors for poor health in this population.
The issue of not including people with disabilities is
reflected in the initial survey design. Most studies are not designed to
include, target, and analyze data on people with disabilities. People with disabilities
could be included as a select population if, for example, the data collection
method ensured appropriate access and outreach.
To remedy these gaps, a set of survey questions has been
developed and is being tested to identify individuals with varying degrees of
disability in terms of activity limitations.[22]
This short set of questions may be placed in the core of all Healthy People
surveillance instruments that collect demographic data to include and standardize
information on people with disabilities. On the basis of standardization and
inclusion in the Nation’s disability data collection activities, the call for
disability statistics may be satisfied. Once collected, these data will help
government policymakers, consumers and advocates, researchers, and clinicians
make better informed choices to promote the health status and well-being of
people with disabilities.
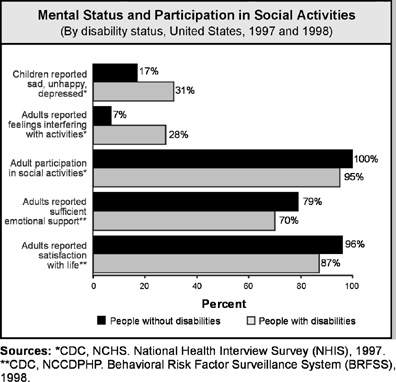
Target: 17
percent.
Baseline: 31
percent of children and adolescents aged 4 to 11 years with disabilities were reported
to be sad, unhappy, or depressed in 1997.
Target setting
method: 45 percent improvement (parity with children and
adolescents without disabilities in 1997).
Data source:
National Health Interview Survey (NHIS), CDC, NCHS.
|
Children and Adolescents Aged 4 to 11 Years,
1997
|
Reported
To Be Sad,
Unhappy, or Depressed
|
|
With
Disabilities
|
Without
Disabilities*
|
|
Percent
|
|
TOTAL
|
31
|
17
|
|
Race and ethnicity
|
|
American Indian or Alaska Native
|
DSU
|
DSU
|
|
Asian or Pacific Islander
|
DSU
|
13
|
|
Asian
|
DSU
|
16
|
|
Native Hawaiian and other
Pacific
Islander
|
DSU
|
DSU
|
|
Black or African American
|
DSU
|
16
|
|
White
|
31
|
17
|
|
|
|
Hispanic or Latino
|
32
|
16
|
|
Not Hispanic or Latino
|
30
|
17
|
|
Black or African American
|
DSU
|
17
|
|
White
|
31
|
18
|
|
Gender
|
|
Female
|
32
|
16
|
|
Male
|
30
|
18
|
|
Family income level
|
|
Poor
|
37
|
20
|
|
Near Poor
|
31
|
17
|
|
Middle/high income
|
27
|
17
|
|
Geographic location
|
|
Urban
|
27
|
17
|
|
Rural
|
39
|
16
|
DNA = Data have not been analyzed. DNC = Data are not
collected. DSU = Data are statistically unreliable.
*The total represents the target. Data for population
groups by race, ethnicity, gender, socioeconomic status, and geographic
location are displayed to further characterize the issue.
Target: 7
percent.
Baseline: 28
percent of adults aged 18 years and older with disabilities reported feelings
that prevented them from being active in 1997 (age adjusted to the year 2000
standard population).
Target setting
method: 75 percent improvement (parity with adults aged 18 years and older
without disabilities in 1997).
Data source:
National Health Interview Survey (NHIS), CDC, NCHS.
|
Adults Aged 18 Years and
Older, 1997
|
Reported
Feelings That
Prevent Activity
|
|
With
Disabilities
|
Without
Disabilities*
|
|
Percent
|
|
TOTAL
|
28
|
7
|
|
Race and ethnicity
|
|
American Indian or Alaska Native
|
22
|
15
|
|
Asian or Pacific Islander
|
30
|
7
|
|
Asian
|
DSU
|
6
|
|
Native Hawaiian and other
Pacific
Islander
|
DSU
|
14
|
|
Black or African American
|
31
|
8
|
|
White
|
28
|
7
|
|
|
|
Hispanic or Latino
|
40
|
9
|
|
Not Hispanic or Latino
|
27
|
7
|
|
Black or African American
|
31
|
8
|
|
White
|
27
|
6
|
|
Gender
|
|
Female
|
30
|
8
|
|
Male
|
26
|
6
|
|
Family income level
|
|
Poor
|
38
|
13
|
|
Near Poor
|
30
|
10
|
|
Middle/high income
|
21
|
6
|
|
Education level (aged 25 years and older)
|
|
Less than high school
|
34
|
10
|
|
High school graduate
|
29
|
7
|
|
At least some college
|
25
|
5
|
|
Geographical location
|
|
Urban
|
29
|
7
|
|
Rural
|
26
|
6
|
|
|
|
|
DNA = Data have not been analyzed. DNC = Data are not
collected. DSU = Data are statistically unreliable.
Note: Age adjusted to the year 2000 standard population.
*The total represents the target. Data for population groups
by race, ethnicity, gender, socioeconomic status, and geographic location are
displayed to further characterize the issue.
Children and adults with
disabilities and their families face issues of coping, adapting, adjusting, and
learning to live well with the disability—a dynamic, ongoing process. Good
mental health, including refusing to internalize the social stigma of
disability and developing a positive attitude and strong self-esteem, is a key
ingredient to overcoming these issues.[23]
Improving mental health status among people with disabilities and their
families will help address psychological barriers and enhance their ability to
participate fully in society.[24]
Target: 100
percent.
Baseline:
95.4 percent of adults aged 18 years and older with disabilities participated
in social activities in 1997 (age adjusted to the year 2000 standard population).
Target setting
method: Total participation (parity with adults aged 18 years and older
without disabilities in 1997).
Data source:
National Health Interview Survey (NHIS), CDC, NCHS.
|
Adults Aged 18 Years and Older, 1997
|
Participation
in Social Activity
|
|
With
Disabilities
|
Without
Disabilities*
|
|
Percent
|
|
TOTAL
|
95.4
|
100.0
|
|
Race and ethnicity
|
|
American Indian or Alaska
Native
|
87.4
|
100.0
|
|
Asian or Pacific Islander
|
99.6
|
100.0
|
|
Asian
|
99.5
|
100.0
|
|
Native Hawaiian and other
Pacific
Islander
|
100.0
|
100.0
|
|
Black or African American
|
95.0
|
99.8
|
|
White
|
95.6
|
100.0
|
|
|
|
Hispanic or Latino
|
93.9
|
100.0
|
|
Not Hispanic or Latino
|
95.5
|
100.0
|
|
Black or African American
|
95.0
|
99.8
|
|
White
|
95.7
|
100.0
|
|
Gender
|
|
Female
|
95.2
|
99.9
|
|
Male
|
95.7
|
100.0
|
|
Family income level
|
|
Poor
|
93.1
|
99.9
|
|
Near Poor
|
95.8
|
99.9
|
|
Middle/high income
|
96.5
|
100.0
|
|
Education
level (aged 25 years and
older)
|
|
Less
than high school
|
94.1
|
99.9
|
|
High
school graduate
|
94.8
|
99.9
|
|
At
least some college
|
96.0
|
100.0
|
|
Geographic location
|
|
Urban
|
95.3
|
100.0
|
|
Rural
|
95.6
|
99.9
|
DNA = Data have not been analyzed. DNC = Data are not
collected. DSU = Data are statistically unreliable.
Note: Age adjusted to the year 2000 standard population.
*The total represents the target. Data for population groups
by race, ethnicity, gender, socioeconomic status, and geographic location are
displayed to further characterize the issue.
People with disabilities
report significantly lower levels of social participation compared with people
without disabilities.[25]
Participating in social activities routinely requires personal interaction with
the environment, a component of life that is vital to the well-being of all
humanity. ICIDH-2, the International Classification of Functioning and Disability,
highlights the importance of participating in social activities as a measurable
outcome of living well with a disability.1
The ICIDH-2 framework indicates that the environment should be examined as a barrier
to participation.
Social participation can
include activities such as volunteering, shopping, going to the movies, or
attending sporting events. Targeting increased participation in regular social
activities such as traveling, socializing with friends and family, attending
church or community events, and voting can result in improved functional status
and well-being.
Target: 79
percent.
Baseline: 71
percent of adults aged 18 years and older with disabilities reported sufficient
emotional support in 1998 (data from 11 States and the District of
columbia; age adjusted to the year 2000 standard population).
Target setting
method: 11 percent improvement (parity with adults aged 18 years and older
without disabilities in 1998).
Data source:
Behavioral Risk Factor Surveillance System (BRFSS), CDC, NCCDPHP.
|
Adults Aged 18 Years and
Older, 1998
|
Reported
Sufficient
Emotional Support*
|
|
With
Disabilities
|
Without
Disabilities**
|
|
Percent
|
|
TOTAL
|
71
|
79
|
|
Race and ethnicity
|
|
American Indian or Alaska Native
|
56
|
72
|
|
Asian or Pacific Islander
|
49
|
66
|
|
Asian
|
DSU
|
DSU
|
|
Native Hawaiian and other
Pacific
Islander
|
DSU
|
DSU
|
|
Black or African American
|
53
|
68
|
|
White
|
74
|
82
|
|
|
|
Hispanic or Latino
|
44
|
68
|
|
Not Hispanic or Latino
|
72
|
80
|
|
Black or African American
|
DNA
|
DNA
|
|
White
|
DNA
|
DNA
|
|
Gender
|
|
Female
|
70
|
79
|
|
Male
|
70
|
78
|
|
Education level (aged 25 years and older)
|
|
Less than high school
|
58
|
70
|
|
High school graduate
|
74
|
76
|
|
At least some college
|
74
|
83
|
|
|
|
|
DNA = Data have not been analyzed. DNC = Data are not
collected. DSU = Data are statistically unreliable.
Note: Age adjusted to the year 2000 standard population.
*Data are from 11 States and the District of Columbia.
**The total represents the target. Data for population groups by race, ethnicity, gender,
socioeconomic status, and geographic location are displayed to further
characterize the issue.
Emotional support often is
derived from a person’s social support systems. Two hypotheses suggest that
social support helps a person cope with stress and that supportive
relationships are a protective factor in various life situations.[26]
With the information gained by monitoring the personal perspective, the United
States may better meet the needs of people with disabilities.
Target: 96
percent.
Baseline: 87
percent of adults aged 18 years and older with disabilities reported
satisfaction with life in 1998 (data from 11 States and the District of Columbia;
age adjusted to the year 2000 standard population).
Target setting
method: 10 percent improvement (parity with adults without
disabilities in 1998).
Data source: Behavioral
Risk Factor Surveillance System (BRFSS), CDC, NCCDPHP.
|
Adults Aged 18 Years and Older, 1998
|
Reported
Satisfaction
With Life*
|
|
With
Disabilities
|
Without
Disabilities**
|
|
Percent
|
|
TOTAL
|
87
|
96
|
|
Race and ethnicity
|
|
American Indian or Alaska Native
|
78
|
92
|
|
Asian or Pacific Islander
|
78
|
98
|
|
Asian
|
DSU
|
DSU
|
|
Native Hawaiian and other Pacific Islander
|
DSU
|
DSU
|
|
Black or African American
|
83
|
92
|
|
White
|
88
|
96
|
|
|
|
Hispanic or Latino
|
80
|
93
|
|
Not Hispanic or Latino
|
87
|
96
|
|
Black or African American
|
DNA
|
DNA
|
|
White
|
DNA
|
DNA
|
|
Gender
|
|
Female
|
87
|
95
|
|
Male
|
86
|
96
|
|
Education
level (aged 25 years and
older)
|
|
Less
than high school
|
84
|
94
|
|
High
school graduate
|
87
|
95
|
|
At
least some college
|
89
|
97
|
|
|
|
|
DNA = Data have not been
analyzed. DNC = Data are not collected. DSU = Data are statistically
unreliable.
Note: Age adjusted to the year 2000 standard population.
*Data are from 11 States and
the District of Columbia.
**The
total represents the target. Data for population groups by race, ethnicity,
gender, socioeconomic status, and geographic location are displayed to further
characterize the issue.
Satisfaction
with life is associated with the more general term “quality of life,” which is
a personal evaluation of one’s own position in numerous dimensions of life,
including physical, emotional, social, spiritual, environmental support, and
level of independence.[27]
Monitoring the life satisfaction of people with disabilities, as well as that
of the broader population, allows an opportunity to evaluate society’s progress
in accommodating the needs of people with disabilities.
Target and
baseline:
|
Objective
|
Reduction in People With
Disabilities in Congregate
Care Facilities
|
1997
Baseline
|
2010
Target
|
|
|
|
Number of Persons
|
|
6-7a.
|
Persons aged 22 years and older
in 16 or more bed congregate
facilities
|
93,362
|
46,681
|
|
6-7b.
|
Persons aged 21 years and under in congregate care facilities
|
24,300
|
0
|
Target setting method: 50 percent
improvement for 6-7a; total elimination for
6-7b.
Data source: Survey of State
Developmental Disabilities Directors, University of Minnesota.
Many people with activity limitations
or cognitive impairments need ongoing and long-term assistance, yet some do not
require institutional care.[28]
From the 1970s through the 1990s, States began reducing the size of and closing
State institutions that served people with mental retardation or developmental
disabilities. This social, political, and economic movement resulted in a
dramatic growth in the total number of individuals served in community
residential settings—from 5,000 in 1960 to 255,117 in 1996.[29], [30] This movement,
coupled with increases in life expectancy and an expanding elderly population,
resulted in the development of several community-based and in-home assistance
programs, such as home-delivered meals, hospice care, and homemaker and
home-health services. The goal to increase home and community-based care will
broaden health and lifestyle choices for people with disabilities and their
families.[31]
Much of this expansion in community
services is funded through the Medicaid Home and Community-Based Services
(HCBS) Waiver Program, a Federal-State partnership authorized in 1981 under
Title XIX of the Social Security Act. Between 1990 and 1997, the HCBS Program
demonstrated a 25.8 percent increase in benefits per person.30
Despite this dramatic growth to support home and community-based care, in 1993,
only 11 percent of long-term Medicaid expenditures and 5.3 percent of
total Medicaid expenditures went toward community-based care.[32] The other sources of support for
community-based long-term care are Medicare, Title III of the Older Americans
Act, and the Social Services Block Grant.32
Target: 82
percent.
Baseline: 52
percent of adults aged 21 through 64 years with disabilities were employed in
1994–95.
Target setting
method: 58 percent improvement (parity with adults without
disabilities in 1994–95).
Data source:
Survey of Income and Program Participation (SIPP), U.S.
department of commerce, bureau of the census.
|
Adults
Aged 21 through 64 Years, 1994–95
|
Employment of People With
Disabilities
|
Employment of People Without Disabilities*
|
|
Percent
|
|
TOTAL
|
52
|
82
|
|
Race
and ethnicity
|
|
American Indian or Alaska Native
|
41
|
77
|
|
Asian or Pacific Islander
|
48
|
78
|
|
Asian
|
DNC
|
DNC
|
|
Native Hawaiian and other Pacific Islander
|
DNC
|
DNC
|
|
Black
or African American
|
37
|
77
|
|
White
|
DNA
|
DNA
|
|
|
|
Hispanic or Latino
|
45
|
76
|
|
Not Hispanic or Latino
|
DNA
|
DNA
|
|
Black or African American
|
DNA
|
DNA
|
|
White
|
57
|
84
|
|
Gender
|
|
Female
|
46
|
75
|
|
Male
|
60
|
90
|
|
Education level
|
|
Less than high school
|
34
|
69
|
|
High school graduate
|
54
|
81
|
|
At least some college
|
63
|
83
|
DNA = Data have not been analyzed. DNC = Data are not
collected. DSU = Data are statistically unreliable.
*The total represents the target. Data for population groups
by race, ethnicity, gender, and socioeconomic status are displayed to further
characterize the issue.
The ability to work has
implications for economic and social self-sufficiency, for full inclusion and
integration into society, and for personal self-esteem. Work and disability are
understood best within the context of a person’s abilities and the role of
accommodation, accessibility, and legal mandates. The Presidential Task Force
on Employment of Adults with Disabilities emphasized the need for a coordinated
and aggressive national policy to address the many components of work and disability.[33]
Changes in economic policies and benefits underscore the need to continue to
examine and address the structural, social, and psychological deterrents to
work for some persons with disabilities.
In 1994–95, employment rates
varied depending on degree of disability. For persons aged 21 through 64 years
with no disability, the rate was 82 percent, whereas those with a nonsevere
disability had a rate of 77 percent, and those with a severe disability had a
rate of 26 percent. Analyses of rates by gender indicate similar patterns.2
Moreover, employment patterns for persons with disabilities mirror general
social patterns of employment rates for age, race, and ethnicity.[34]
Education has a positive association with employment for all people, although
the association is strongest for adolescents and adults with a “work disability.”
Target: 60
percent.
Baseline: 45
percent of children and youth aged 6 to 21 years with disabilities spent at
least 80 percent of their time in regular education programs in the
1995–96 school year.
Target setting
method: 33 percent improvement. (Better than the best will be used when
data are available.)
Data source:
Data Analysis System (DANS), U.S. Department of Education,
office of special education.
Data for population groups currently are not analyzed. |
This objective aims to improve
the well-being of students with disabilities by encouraging academic and
learning opportunities and nonacademic social and emotional experiences that
can facilitate normal growth and development, postsecondary educational
attainment, independent living skills, and economic participation as adults.
Serving students with disabilities in regular nonspecial education classrooms
is a concern that cuts across the goals of many Federal agencies. The current
target of the Office of Special Education and Rehabilitative Services is that
60 percent of children and youth with disabilities aged 6 through 21 years
will be reported by the States as being served in the regular education
classroom at least 80 percent of the time. In support of the target, the 1997
Amendments to the Individuals with Disabilities Education Act states that “to
the maximum extent appropriate, children and youth with disabilities, including
children in public or private institutions or other care facilities, are
educated with children who are not disabled.”[35]
Potential data
source: National Independent Living Centers Network.
For people with disabilities to have
the opportunity for healthy lives, both physically and emotionally, programs
and facilities that offer wellness and treatment services must be fully
accessible. Effective enforcement of the Americans with Disabilities Act can improve
services for people with disabilities and help prevent secondary disabilities.
Potential data
source: National Health Interview Survey (NHIS), CDC, NCHS.
In
1990, a one-time survey showed that 2.5 million people said they needed assistive
technology that they did not have.[36]
The inability to pay for such technology was the main reason given for the
unmet need. Assistive technology can be critical in the lives of people with
disabilities; thus, technology need, availability, and use must be studied.[37]
Technology can aid the independence and self-sufficiency of people with
disabilities and can enable people to work, attend school, and participate in
community life. Without assistive technology, people with disabilities may
become dependent and isolated.
Potential data
source: Behavioral Risk Factor Surveillance System (BRFSS), CDC, NCCDPHP.
The
focus on measuring the environmental impact on people with disabilities echoes the underlying theme of the disability rights movement and the ADA.[38]
Both argue that the most important outcome for persons with disabilities—in
fact, for all persons in the United States—is their full participation as
active, involved, and productive members of society. Indeed, this participation
is the implicit outcome for the overarching Healthy People goals to achieve a
healthier life and eliminate disparities.
A
special 1999 Colorado Behavioral Risk Factor Surveillance System (BRFSS) survey
showed that compared to 43 percent of people without disabilities, 55 percent
of adults aged 18 years and older with disabilities reported encountering environmental
barriers daily or weekly and/or barriers that were very problematic.[39]
Similar data will be collected from several other States.
Full
participation cannot be achieved without eliminating environmental barriers
found within architectural structures, technology, organizational policies and
practices, and social attitudes and without moving toward universal design and
nondiscriminatory elements. Thus public health agencies need to measure not
only the nature and extent of disability in the United States but also the
extent to which environmental barriers and universal design elements impede or
facilitate social participation.
Target and
baseline:
|
Objective
|
Increase in Public Health
Surveillance and Health Promotion Programs for People With
Disabilities and Caregivers
|
1999
Baseline
|
2010
Target
|
|
|
|
Number
|
|
6-13a.
|
States and the District
of Columbia
|
14
|
51
|
|
6-13b.
|
Tribes
|
Developmental
|
Target setting
method: Total coverage.
Data sources:
Tribal, State, and District of Columbia reports; Office on Disability and
Health, CDC.
The
needs of people with disabilities and caregivers should be addressed by public
health activities. In a telephone survey, 23 percent of all U.S. households included
at least one caregiver.[40]
While not all people with disabilities are dependent on the services of an
unpaid (usually a family member) or paid caregiver, meeting the needs of those
who benefit from personal assistance cannot be easily separated from the needs
of people who provide assistance.[41] Whether caring for infants,
children, or adults with disabilities or for the increasing number of people
who become activity-limited as they grow older, the caregiver is an important
health component.[42]
 | |
1. |
Access to
Quality Health Services |
|
|
|
|
| 1-1. | | Persons with
health insurance |
| 1-4. | | Source of
ongoing care |
| 1-5. | | Usual primary
care provider |
| 1-6. | | Difficulties or
delays in obtaining needed health care |
| 1-16. | | Pressure ulcers
among nursing home residents |
| |
2. |
Arthritis,
Osteoporosis, and Chronic Back Conditions |
| |
3. |
Cancer |
| |
4. |
Chronic
Kidney Disease |
| |
5. |
Diabetes |
|
|
|
|
| 5-1. | | Diabetes education |
| 5-2. | | New cases of diabetes |
| 5-3. | | Overall cases of diagnosed diabetes |
| 5-4. | | Diagnosis of diabetes |
| 5-9. | | Foot ulcers |
| 5-10. | | Lower extremity amputations |
| |
7. |
Educational
and Community-Based Programs |
|
|
|
|
| 7-1. | | High school completion |
| 7-3. | | Health-risk behavior information for college and university students |
| 7-6. | | Participation in employer-sponsored health promotion activities |
| 7-11. | |
Culturally appropriate and linguistically competent community health promotion programs |
| 7-12. | | Older adult participation in community health promotion activities |
| |
9. |
Family
Planning |
| |
12. |
Heart Disease
and Stroke |
|
|
|
|
| 12-1. | | Coronary heart
disease (CHD) deaths |
| 12-7. | | Stroke deaths |
| 12-9. | | High blood
pressure |
| 12-10. | | High blood
pressure control |
| 12-11. | | Action to help control blood pressure |
| 12-12. | | Blood pressure monitoring |
| 12-13. | | Mean total blood cholesterol levels |
| 12-14. | | High blood cholesterol levels |
| 12-15. | | Blood cholesterol screening |
| |
14. |
Immunization
and Infectious Diseases |
| |
16. |
Maternal,
Infant, and Child Health |
|
|
|
|
| 16-1. | | Fetal and infant deaths |
| 16-2. | | Child deaths |
| 16-3. | | Adolescent and young adult deaths |
| 16-4. | | Maternal deaths |
| 16-6. | | Prenatal care |
| 16-9. | | Cesarean births |
| 16-10. | | Low birth weight and very low birth weight |
| 16-11. | | Preterm births |
| 16-13. | | Infants put to sleep on their backs |
| 16-16. | | Optimum folic acid levels |
| 16-17. | | Prenatal substance exposure |
| 16-19. | | Breastfeeding |
| 16-21. | | Sepsis among children with sickle cell disease |
| 16-22. | | Medical homes for children with special health care needs |
| 16-23. | | Service systems for children with special health care needs |
| |
17. |
Medical
Product Safety |
| |
18. |
Mental Health
and Mental Disorders |
| |
19. |
Nutrition and
Overweight |
|
|
|
|
| 19-1. | | Healthy weight in adults |
| 19-2. | | Obesity in adults |
| 19-3. | | Overweight or obesity in children and adolescents |
| 19-4. | | Growth retardation in children |
| 19-5. | | Fruit intake |
| 19-6. | | Vegetable intake |
| 19-7. | | Grain product intake |
| 19-8. | | Saturated fat intake |
| 19-9. | | Total fat intake |
| 19-10. | | Sodium intake |
| 19-11. | | Calcium intake |
| 19-12. | | Iron deficiency in young children and in females of childbearing age |
| 19-13. | | Anemia in low-income pregnant females |
| 19-17. | | Nutrition counseling for medical conditions |
| 19-18. | | Food security |
| |
20. |
Occupational
Safety and Health |
| |
21. |
Oral Health |
|
|
|
|
| 21-1. | | Dental caries experience |
| 21-2. | | Untreated dental decay |
| 21-3. | | No permanent tooth loss |
| 21-4. | | Complete tooth loss |
| 21-5. | | Periodontal disease |
| 21-6. | | Early detection of oral and pharyngeal cancers |
| 21-8. | | Dental sealants |
| 21-10. | | Use of oral health care system |
| 21-15. | | Referral for cleft lip or palate |
| 21-16. | | Oral and craniofacial State-based surveillance system |
| |
22. |
Physical
Activity and Fitness |
|
|
|
|
| 22-1. | | No leisure-time physical activity |
| 22-2. | | Moderate physical activity |
| 22-3. | | Vigorous physical activity |
| 22-4. | | Muscular strength and endurance |
| 22-5. | | Flexibility |
| |
23. |
Public Health
Infrastructure |
| |
24. |
Respiratory
Diseases |
|
|
|
|
| 24-1. | | Deaths from asthma |
| 24-2. | | Hospitalizations for asthma |
| 24-3. | | Hospital emergency department visits for asthma |
| 24-4. | | Activity limitations |
| 24-5. | | School or work days lost |
| 24-6. | | Patient education |
| 24-7. | | Appropriate asthma care |
| 24-8. | | Surveillance systems |
| 24-9. | | Activity limitations due to chronic lung and breathing problems |
| 24-10. | | Deaths from COPD |
| |
27. |
Tobacco Use |
| |
28. |
Vision and Hearing |
(A listing of abbreviations and acronyms used in this
publication appears in Appendix H.)
Activity limitations: Problems in a person’s performance of everyday
functions such as communication, self-care, mobility, learning, and behavior.
Assistive devices and technology: Under the Assistive
Technology Act of 1998 (Public Law 105-394), “any
item, piece of equipment, or product system, whether acquired commercially,
modified, or customized, that is used to increase, maintain, or improve the functional
capabilities of individuals with disabilities.”
Congregate care facilities: An out-of-home facility
that provides housing for people with disabilities in which rotating staff
members provide care—16 or
more beds when referring to adults and any number of beds when referring to
children and youth under age 21 years. Congregate care excludes foster care,
adoptive homes, residential schools, correctional facilities, and nursing facilities.30
Disability: The general term used to represent the
interactions between individuals with a health condition and barriers in their
environment.
Environmental factors: The policies, systems, social
contexts, and physical barriers or facilitators that affect a person’s participation in activities,
including work, school, leisure, and community events.
Health promotion: Efforts to create healthy
lifestyles and a healthy environment to prevent medical and other secondary
conditions, such as teaching people how to address their health care needs and
increasing opportunities to participate in usual life activities.
ICIDH-2: International Classification of
Functioning and Disability, the World Health Organization’s conceptual and coding framework
for describing a person’s
functioning and disability associated with his or her health condition.
People with disabilities: People identified as having
an activity limitation or who use assistance or who perceive themselves as
having a disability.
Permanency planning: A planning process undertaken by
public and private agencies on behalf of a child with developmental
disabilities and their families with the explicit goal of securing a permanent
living arrangement that enhances the child’s
growth and development.41
Secondary conditions:
Medical, social, emotional, mental, family, or community problems that a person
with a primary disabling condition likely experiences.
[1]
World Health Organization (WHO). International
Classification of Functioning and Disability (ICIDH-2): Beta-1 Draft for Field
Trials. Geneva, Switzerland: WHO, 1997, 11-21, 206-215, 221-225.
[2]
McNeil, J.M. Americans with disabilities 1994–95. Current
Populations Report P7061:3-6, August 1997.
[3]
National Institute on Disability and Rehabilitation Research. Trends in Disability Prevalence and Their Causes:
Proceedings of the Fourth National Disability Statistics and Policy Forum, May
16, 1997, Washington, DC. San Francisco, CA: The Disability Statistics
Rehabilitation Research and Training Center, 1998.
[4]
Institute of Medicine. Enabling America: Assessing
the Role of Rehabilitation Science and Engineering. Washington, DC:
National Academy Press, 1997, 2.
[5]
U.S. Department of Health and Human Services (HHS). Healthy
People 2000: National Health Promotion and Disease Prevention Objectives.
Pub. No. (PHS) 91-50213. Washington, DC: HHS, Public Health Service (PHS),
Office of Disease Prevention and Health Promotion (ODPHP), 1991, 39-42.
[6]
Centers for Disease Control and Prevention (CDC). Health-related quality of
life and activity limitation—Eight states, 1995. Morbidity
and Mortality Weekly Report (47):134-140, 1998.
PubMed; PMID 9498296
[7]
Manton, K.; Corder, L.; and Stallard, E. Chronic
Disability Trends in Elderly in United States Populations 1982–1994.
Washington, DC: National Academy of Sciences, 1997, 2593-2598.
[8]
Zola, I. Disability statistics, what we count and what it tells us, a personal
and political analysis. Journal of Disability Policy
Studies 4(2):10-39, 1993.
[9]
Hahn, H. The political implications of disability definitions and data. Journal of Disability Policy Studies 4(2):42-52,
1993.
[10]
HHS. Healthy People 2000 Progress Review, People With
Disabilities. Washington, DC: HHS, PHS, ODPHP, 1997, 1-3.
[11]
Seekins, T.; White, G.; Ravesloot, C.; et al. Developing and evaluating
community-based health promotion programs for people with disabilities. In: Secondary Conditions Among People With Disabilities:
Current Research and Trends. Pacific Grove, CA: Brookes-Cole Publisher,
in press.
[12]
Lorig, K. A workplace health education program that reduces outpatient visits. Medical Care 9:1044-1054, 1995.
PubMed; PMID 4033235
[13]
Research and Training Center on Rural Rehabilitation. Cost Containment Through Disability Prevention: Preliminary
Results of a Health Promotion Workshop for People With Physical Disabilities.
Missoula, MT: University of Montana, the Center, 1996.
[14] Lorig, K.; Lubeck, D.; Kraines, R.; et
al. Outcomes of self-help education for patients with arthritis. Arthritis Rheumatism 28(6):680-685, 1985.
PubMed; PMID 4004977
[15]
National Osteoporosis Foundation. Physician Guide to
Prevention and Treatment of Osteoporosis. Washington, DC: the
Foundation, 1998.
[16]
Melnikova, N; Hough, J.; and Lollar, D. Osteoporosis among women with physical
disabilities: Risk factors and protective factors. Paper presented at 126th
Annual Meeting of the American Public Health Association, Disability Forum
Special Interest Group in Washington, DC, November 17, 1998.
[17]
HHS. Healthy People in Healthy Communities: A Guide
for Community Leaders. Washington, DC: HHS, PHS, Office of Public Health
and Science (OPHS), ODPHP, 1998.
[18]
HHS. U.S. Preventive Services Task Force: Guide to
Clinical Preventive Services. 2nd ed. Washington, DC: HHS, OPHS, ODPHP,
1995, Chapter V.
[19]
HHS. Task Force on Community Preventive Services:
Guide to Community Preventive Services. Washington, DC: HHS, in press.
[20]
U.S. Public Health Service. Putting Prevention Into
Practice: Clinicians Handbook of Preventive Services. 2nd ed. McLean,
VA: International Medical Publishing, Inc., 1998, Chapter 36.
[21]
National Council on Disability. Reorienting
Disability Research: Letter to the United States President. Washington,
DC: the Council, 1998, 1-17.
[22]
Office on Disability and Health. 1999 Behavioral Risk
Factor Surveillance System Disability Module. Atlanta, GA: CDC, 1999.
[23]
Tuttle, D. Self Esteem and Adjusting With Blindness:
The Process of Responding to Life Demands. Springfield, IL: Charles C.
Thomas Publisher, 1984, 61, 145-158.
[24]
Sowers, J., and Powers, L. Enhancing the participation and independence of
students with severe and multiple disabilities in performing community
activities. Mental Retardation 33(4):209-220,
1995.
PubMed; PMID 7565143
[25]
Kaye, S. Is the status of people with disabilities improving? Disability Status Abstract (21):3-4, May 1998.
[26]
Novack, T., and Gage, R. Assessment of family functioning and social support.
In: Cushman, L., and Scherer, M., eds. Psychological
Assessment in Medical Rehabilitation. Washington, DC: American
Psychological Association, 1995, 286-297.
[27]
Patrick, D. Rethinking prevention for people with disabilities part 1: A
conceptual model for promoting health. American
Journal of Health Promotion 11(4):25-260, 1997.
PubMed; PMID 10172932
[28]
Swain, P. Helping disabled people: The users view. British
Medical Journal 306(6883):990-992, 1993.
PubMed; PMID 8490483
[29]
Braddock, D.; Hemp, R.; Parish, S.; et al. The State
of the States in Developmental Disabilities. 5th ed. Washington, DC:
American Association on Mental Retardation, 1998, 9-10.
[30]
Prouty, R., and Lakin, K. Residential Services for
Persons With Developmental Disabilities: Status and Trends Through 1997.
Minneapolis, MN: University of Minnesota, Research Training Center on Community
Living, Institute on Community Integration, 1998, xii, 47, 53, 58, 60, 65-67,
76, 88, 101.
[31]
Kane, R. Expanding the home care concept: Blurring distinctions among home
care, institutional care and other long-term care facilities. Milbank Quarterly 73(2):161-186, 1995.
PubMed; PMID 7776944
[32]
Hardwick, S.; Pack, J.; Donohoe, E.; et al. Across
the States 1994: Profiles of Long-Term Care Systems. Washington, DC:
American Association of Retired Persons, Center on Elderly People Living Alone,
Public Policy Institute, 1994, 5-7.
[33]
Presidential Task Force on Employment of Adults with Disabilities. Recharting the Course: First Report. Washington, DC:
the Task Force, 1998.
[34] Stoddard, S.; Jans, L.; Ripple, J.; et
al. Chartbook on Work and Disabilities in the
United States, 1998. Washington, DC: U.S. Department of Education (DoE),
National Institute on Disability and Rehabilitation, 1998.
[35]
DoE. To Assure the Free Appropriate Public Education
of All Children with Disabilities: Nineteenth Annual Report to Congress on the
Implementation of the Individuals with Disabilities Education Act, Section 618.
Washington, DC: DoE, 1997.
[36]
Laplante, M.; Hendershot, G.; and Moss, A. Assistive technology devices and
home accessibility features: Prevalence, payment, need, and trends. In: Advance Data from Vital and Health Statistics: No. 217.
Hyattsville, MD: National Center for Health Statistics, 1992.
[37]
National Council on Disability. Study on Financing of
Assistive Technology Devices and Services for Individuals With Disabilities.
Washington, DC: the Council, 1993.
[38]
National Council on Disability. Equality of
Opportunity: The Making of the Americans with Disabilities Act.
Washington, DC: the Council, 1997, 9-21.
[39]
Craig Hospital and the Colorado Department of Public Health and Environment.
Craig Hospital Inventory of Environmental Factors. Short form (CHIEF SF). Colorado 1999 Behavioral Risk Surveillance System
Disability Study. Englewood, CO: Craig Hospital, Denver, CO, and
Colorado Department of Public Health and Environment, Survey Research Unit.
[40]
National Alliance for Caregiving and the American Association of Retired
Persons. Family Caregiving in the U.S.: Findings From
a National Survey. Bethesda, MD: American Association of Retired
Persons, Washington, DC, 1997, 8.
[41]
Singer, G., and Irvin, L. Support for Caregiving
Families: Enabling Positive Adaptation to Disability. Baltimore, MD:
Paul H. Brooks Publishing Company, 1989, 44.
[42]
Pugliese, J.M.; Ingram, T.O.; and Edwards, G. Stability
of Employment Status of Caregivers Who Have a Child With a Disability.
Birmingham, AL: United Cerebral Palsy of Greater Birmingham, Inc., 1998.
