|
Elevation
The National Elevation Dataset (NED) is a seamless raster product primarily derived from USGS 10- and 30-meter Digital Elevation Models (DEMs), and, increasingly, from higher resolution data sources such as light detection and ranging (lidar), interferometric synthetic aperture radar (ifsar), and high-resolution imagery. NED data are available from The National Map Viewer as 1 arc-second (approximately 30 meters) for the CONUS, and at 1/3 and 1/9 arc-seconds (approximately 10 and 3 meters, respectively) for parts of the United States. NED resolution for Alaska is primarily 2 arc-seconds (approximately 60 meters) but is rapidly being replaced with 5-meter resolution ifsar data State-wide and lidar over select areas. Lidar point cloud data is available for download from Earth Explorer.
In response to growing needs for high-quality topographic data and for a wide range of other three-dimensional representations of the Nation's natural and constructed features, the National Geospatial Program has introduced the 3D Elevation Program (3DEP) initiative, the goal of which is to systematically collect enhanced elevation data in the form of high-quality lidar data over the conterminous United States (CONUS), Hawaii, and the U.S. territories. Ifsar data will be collected over Alaska, where cloud cover and remote locations preclude the use of lidar over much of the State. The 3DEP initiative will result in higher resolution and more accurate data as well as new products in the future.
|
|

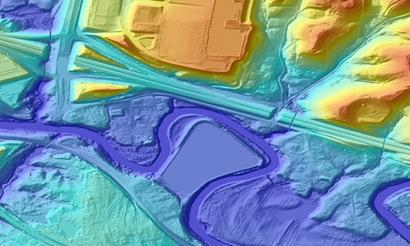
Image of an 'all-return lidar point cloud' featuring the USGS Earth Resources Observation and Science (EROS) Center in Sioux Falls, SD.
|

New NED elevation data includes the San Luis Valley, Colorado
|
Status & highlights
The October, 2012 update of the National Elevation Dataset (NED), the 68th update since bi-monthly revisions began in June, 2000, includes new light detection and ranging (lidar) data in addition to new standard production 10-meter digital elevation models (DEMs). New elevation data of note featured in this release include coverage over more than 3800 square miles of the San Luis Valley in Colorado, the largest alpine valley in the world and elevation data from high resolution lidar over the area of the 2011 Virginia earthquake.
The status graphic on the left (click graphic for larger version...) is one of several contained in the NED Release Notes for October, 2012 (PDF), which is published on a bi-monthly basis.
The San Luis Valley provides the setting for a wide range of scientific applications such as mapping fault scarps and sand dune migration, delineating potential flood zones, studying geothermal energy potential, monitoring vegetation change, determining wetland capacity, and conducting soil surveys. The project is a collaborative, multi-agency effort comprised of the USGS, U.S. Fish and Wildlife Service, National Park Service; Department of Homeland Security: Federal Emergency Management Agency; Natural Resources Conservation Service; and the State of Colorado: Colorado Geological Survey.
A lidar dataset is being released over the epicentral area of the August 23, 2011 Virginia earthquake, one of the strongest earthquakes, 5.8 magnitude, to hit the East Coast in nearly seventy years. This lidar coverage includes parts of Louisa, Fluvanna, Goochland, and Spotsylvania Counties. The USGS has identified the Central Virginia seismic zone as an area of elevated earthquake hazard since the middle 1970s. However, other than the infrequent small to moderate earthquakes that have occurred there in historical time, little is known about the earthquake potential in this area. The USGS has placed a high priority on understanding why earthquakes are occurring in this region and the lidar data will hopefully allow for new understanding of the earthquake hazard there.
Over the course of Fiscal Year 2013 (October 1, 2012 - September 30, 2013), the NED will transition from its current home at the EROS Data Center to the National Geospatial Technical Operations Center. Proposed plans for the NED include services to provide derivatives from DEMs and point cloud data.
|
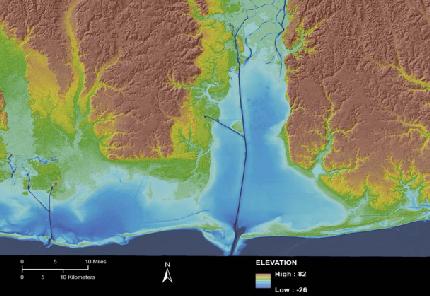
Graphic representation of topo-bathymetric data for Mobile Bay, Alabama
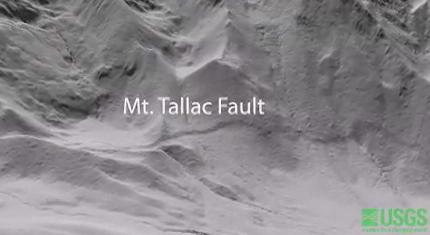
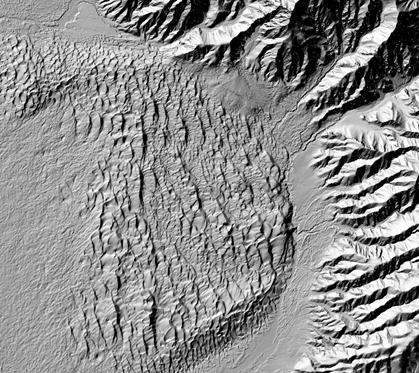
Frame from lidar imagery video identifying the Mt. Tallac Fault, California.
|
|
|
|