Special Notices
New Functionality for all Data Retrieval Tools!
As we move closer to restoring functionality previously available in the Series Report tool, the following features are NOW available in all BLS data retrieval tools (Top Picks, Series Report, One-Screen, and Multi-Screen) on the BLS website:
- Ability to retrieve multiple series IDs in one table - HTML or Text (Comma or Tab delimited). Select “Multi-series table” under ‘Select view of data’ on the Formatting Options page.
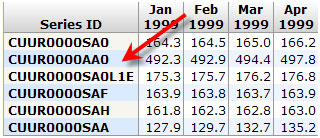
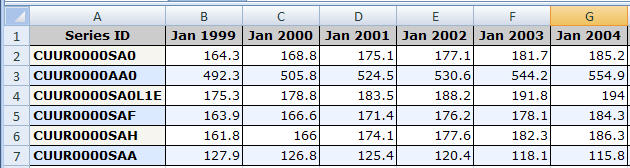
- Ability to not display the series catalog. Select the “Multi-series table” format under ‘Select view of data’ on the Formatting Options page.
Not displaying the series catalog allows data user to easily copy and paste data to an Excel spreadsheet with minimal reformatting.
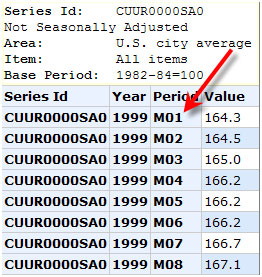
- Tools now return periods as M01 or Q01 instead of the three-letter English month abbreviation (for example, Jan, Feb, Mar etc.). Select the “Column Format” under ‘Select view of data’ on the Formatting Options page. Displaying the period as M01 allows data users the ability to sort data with minimal reformatting after import to an Excel spreadsheet.
- User friendly interface design for users who require additional data view options. The following are among features now available when using all BLS data retrieval tools:
- Percent and Net change calculations - Instead of entering discrete period/year date(s) such as m01/1992, user can now simply select from a list of available intervals ranging from 1-month to 12-month time periods.
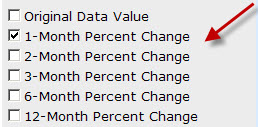
Note: Percent and Net Change calculations may not be available for all databases.
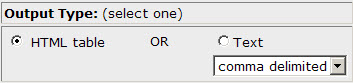
- HTML or Text Output - Users have an option to display their query results in HTML or Text (Comma or Tab delimited) format.
- Display Graphs - Users also have the added bonus to display their query results in graph output format.
Note: Graph is not available for the Multi-Series Table option.
Our work on restoring the functionality previously available in the Series Report tool continues to progress. Again, thank you for your continued patience as we constantly work towards improving the BLS website.
Last Modified Date: November 06, 2009