Maps and Data
Find maps and charts showing transportation data and trends related to alternative fuels and vehicles.
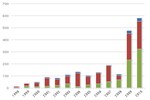
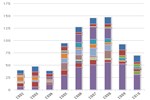
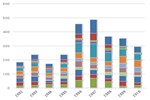
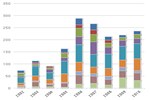
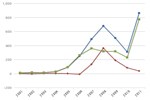
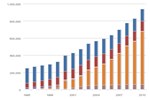
Clean Cities Funding
| 1998 | 1999 | 2000 | 2001 | 2002 | 2003 | 2004 | 2005 | 2006 | 2007 | 2008 | 2009 | 2010 | 2011 | |
| CC Budget | [object Object] | [object Object] | 7.7 | 10 | 11 | 11.1 | 11 | 10.6 | 8 | 4.4 | 12.48 | 25 | 25.5 | 26.8 |
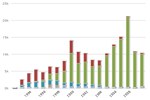
| Project Awards | 8.5 | 19.4 | 32 | 66.8 | 51.5 | 64 | 111 | 68.7 | 87.3 | 131.8 | 34 | 221 | 232.4 | 54.5 |
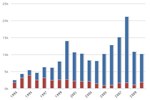
| Matching Funds | 2 | 15 | 8.6 | 11.8 | 18 | 32 | 10 | 22.7 | 33.1 | 50.8 | 66.1 | 229.3 | 320 | 28.6 |
Source: Clean Cities annual coalition reports, 2004-2011.
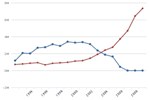
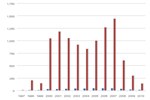
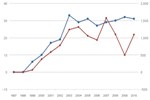
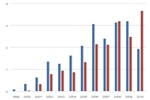
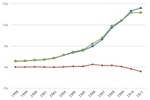
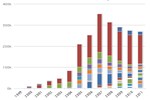
This chart shows trends in Clean Cities funding, including program budgets, competitive project awards to coalitions and stakeholders, and matching funds from project partners, from 1998 to 2011. High levels of funding in 2009 and 2010 are largely due to project awards from the American Recovery and Reinvestment Act and corresponding matching funds from project partners.