
Focus on Prices and Spending | Import and Export Prices | Volume 2, Number 13
Current Price Topics: A Rollercoaster Year for Export Agriculture Prices
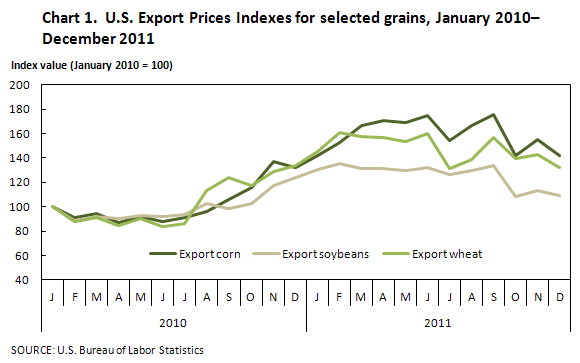
U.S. agricultural exports had a volatile year in 2011. The price index for exported agricultural goods increased 9.4 percent during the first 6 months of the year, after rising 20.5 percent in 2010 and 9.2 percent in 2009. However, during the final 6 months of the year, agricultural goods prices sharply declined by 7.9 percent. The primary contributors to the rise and subsequent downturn were grains, oilseeds, and cotton. Corn, soybeans, wheat, and cotton all experienced an increase and then subsequent decline in prices during 2011. In each case, the volatility resulted from both supply and demand factors.
As seen in chart 1, after advancing 34.9 percent in 2010, the price index for corn reached a 2-year high at the beginning of 2011 and continued to rise steadily through June. The index increased 32.5 percent over the first 6 months of the year. Many of the same factors that drove up corn prices in 2010 continued to drive prices in 2011. On the supply side, Mexico, already one of the largest importers of grain, was forced to increase imports because freezing weather reduced the country's grain production by as much as 12 percent. [1] Cold and wet weather through much of the midwestern United States in April also helped drive corn prices higher as planting was delayed in many areas and total acreage planted was expected to fall. [2]
On the demand side, high demand for corn was also a major factor in the rise in corn prices during the first part of 2011. The increase in demand was especially acute for the feed corn needed to meet the growing demand for meat products in Asia. In addition, 38.5 percent of the corn usage during the 2010–2011 season went towards ethanol production, taking a large amount of corn off the world food market. [3]
In contrast to the first half of the year, the final 6 months of 2011 were marked by a large amount of volatility. At the end of the 2011, corn prices had fallen 18.6 percent, leaving an increase of only 7.9 percent for the year. Much of the second-half decline in the price of corn was attributable to an increase in supply, with U.S. farmers planting 91.92 million acres, the second highest amount of acreage since 1944. [4] The increase in acreage was a direct response to the high prices that prevailed at the end of 2010 and the beginning of 2011.
The price index for soybeans posted a large increase in 2010 and continued to rise over the first 6 months of 2011. Much of the increase in prices was because of a decrease in supplies of soybeans from the United States, the world's largest grower and exporter of soybeans. In October 2010, the U.S. Department of Agriculture estimated that inventories would be 265 million bushels in August 2011, but readjusted the estimate in November to 185 million bushels because of the vastly decreased harvest. [5] Strong international demand for soybeans for animal feed also helped push prices higher.
During the final 6 months of 2011, the price of soybeans fell 17.6 percent, and for the year it declined 11.8 percent. The annual decrease was in stark contrast to the previous 2 years when prices rose 23.4 percent and 26.6 percent, respectively. Although the U.S. harvest was small, record high soybean stocks in Brazil and Argentina boosted global supply and caused the price of soybeans to drop. [6]
In 2010, wheat prices increased 35.1 percent over the year, and they continued to rise 19.3 percent during the first 6 months of 2011, before declining 17.5 percent over the final 6 months of the year. Driving the massive increase in the price of wheat during 2010 was an export ban put in place by Russia as a means of protecting Russian consumers during a devastating drought. As a result of this ban, the United States exported even more wheat, sending more than 34 million metric tons abroad from June 2010 to May 2011. [7] The price of wheat began to decline in July 2011, and one of the major factors was the end of the Russian export ban. The return of Russian wheat to the international market alleviated the strain of a very tight market.
Of all of the large price increases of agricultural commodities in 2010, none was more pronounced than that of cotton. The United States is the world's largest exporter of cotton, [8] and the price index for cotton increased 153.8 percent from March 2010 to March 2011, with spot prices reaching levels not seen since the Reconstruction. (See chart 2.) The unprecedented increase in prices was brought about by supply shortages caused by adverse weather in the United States, China, and Pakistan, three of the top four cotton producing countries, as well as an export ban from India, the other country in the top four. [9] Global demand turned to the United States as a source of cotton, and exports increased to over 14 million bales. [10]
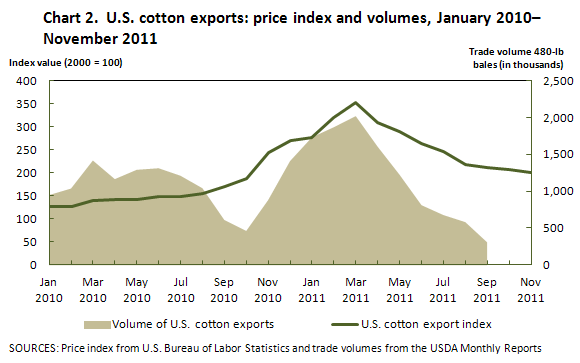
The price trend began to reverse in April 2011, and the price index for cotton declined 29.1 percent. The swift decline in prices was brought about by a sharp decline in demand. By July, imports of cotton to China, the world's largest consumer, declined 32 percent on a year-over-year basis. [11]
Current Price Trends: 2011 Price Highlights
Import Prices
Led by higher prices for both fuel and nonfuel prices, import prices increased for the third consecutive year in 2011, rising 8.5 percent after advancing 5.3 percent in 2010 and 8.6 percent in 2009. In early 2011 import prices followed the trend of the previous 2 years, rising 9.2 percent over the first 5 months of the year, but prices subsequently moderated and edged down 0.6 percent from May through December.
| Item | 2002 | 2003 | 2004 | 2005 | 2006 | 2007 | 2008 | 2009 | 2010 | 2011 |
|---|---|---|---|---|---|---|---|---|---|---|
All-commodity imports |
4.2 | 2.4 | 6.7 | 8.0 | 2.5 | 10.6 | -10.1 | 8.6 | 5.3 | 8.5 |
Excluding fuels |
0.0 | 1.0 | 3.0 | 1.1 | 2.9 | 3.1 | 1.2 | 0.3 | 3.0 | 3.4 |
Fuels |
53.7 | 13.2 | 31.5 | 43.5 | 0.9 | 42.1 | -47 | 62.2 | 14.2 | 25.2 |
All-commodity exports |
1.0 | 2.2 | 4.0 | 2.8 | 4.5 | 6.0 | -2.9 | 3.4 | 6.5 | 3.6 |
Excluding agricultural |
0.4 | 1.3 | 5.0 | 2.6 | 3.7 | 4.5 | -2.2 | 2.9 | 5.1 | 4.0 |
Agricultural |
8.0 | 13.4 | -5.9 | 4.9 | 13.5 | 23.3 | -10.9 | 9.2 | 20.5 | 0.8 |
Fuel Import Prices
Import fuel prices rose 25.2 percent in 2011, after increasing 14.2 percent the previous year and 62.2 percent in 2009. Fuel prices increased 15.4 percent in the final quarter of 2010 and continued to rise 29.6 percent over the first 4 months of 2011. However, with the exception of a 3.7-percent upturn in November, prices for import fuel trended mostly downward the remainder of the year, decreasing 3.4 percent from April through December.
The price index for imported petroleum drove the overall increase in fuel prices in 2011, rising 27.4 percent for the year. That increase followed advances of 16.2 percent and 78.6 percent, respectively, in 2010 and 2009. The 2011 rise in petroleum prices primarily took place over the first 4 months of the year, when the index rose 31.2 percent. Both supply concerns resulting from political unrest in North Africa, and strong worldwide demand in early 2011, contributed to the higher prices. The political unrest began in January, when Egyptian citizens protested against the Egyptian government, leading to the resignation of Egyptian President Hosni Mubarak on February 11. [12] Although Egypt is a relatively small oil producer, there were fears that the turmoil might lead to disruptions in the traffic of oil passing through the Suez Canal into Europe. Even greater concern was caused by a brief civil war that broke out in Libya in February, which reduced Libyan oil exports from more than one and a half billion barrels a day before the crisis to 200,000 barrels a day by April. [13] Meanwhile, strong demand from OECD (Organisation for Economic Co-operation and Development) countries recovering from the recent economic downturn, a jump in demand from Japan following the devastating March earthquake, and growing demand from China also contributed to the rise in oil prices. [14]
The upward trend in petroleum prices came to an abrupt halt on May 5, 2011, when crude oil prices fell approximately 9 percent in 1 day. From May through December, the price index for imported petroleum fell 2.2 percent. Increased output from Saudi Arabia, Nigeria, Kuwait, and Iraq largely offset the lost production from Libya. [15] Petroleum demand fell as a result of the jump in oil prices as well as worsening economic conditions. The biggest drop in demand came from the European Union, where the continuing European debt crisis brought into question the viability of the continuation of a single European currency. [16]
The weakening euro helped push the value of the U.S. dollar up 5.2 percent between April and December, which also led to lower petroleum prices. [17]For the year, natural gas prices fell 9.4 percent, somewhat offsetting the higher petroleum prices. The decline followed a 14.5-percent decrease in 2010 and marked the sixth consecutive year natural gas prices fell after peaking in 2005 in the aftermath of Hurricane Katrina. Demand for natural gas remains low and working natural gas storage in the United States hit the highest monthly average on record at the end of October. [18]
Nonfuel Import Prices
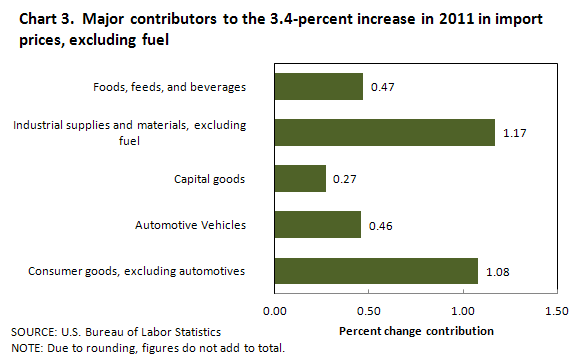
Import prices excluding fuel also rose overall in 2011, advancing 3.4 percent for the year after recording a 3.0-percent increase in 2010. The 2011 rise was the largest calendar-year advance since the index was first published in December 2001. Chart 3 shows an increase in the price index for nonfuel industrial supplies and materials and a rise in consumer goods prices were the largest contributors to the overall advance in nonfuel prices, although prices for each of the other major import categories—foods, feeds, and beverages; automotive vehicles; and capital goods—all rose in 2011 as well.
Nonfuel industrial supplies and materials prices advanced 6.8 percent in 2011 after rising 12.2 percent the previous year. The 2011 increase was driven by an 8.8-percent jump over the first 5 months of the year before prices for nonfuel imports fell 1.8 percent between May and December. As was the case in 2010, higher prices for chemicals and unfinished metals were the largest contributors to the overall increase in nonfuel prices. Chemical prices advanced 9.2 percent over the first 5 months of the year and rose 11.7 percent overall in 2011. Unfinished metals prices advanced 4.8 percent in 2011, although the 14.5-percent rise between December 2010 and May was partially offset by an 8.4-percent drop in the index over the final 7 months of the year. Chemical prices rose because of higher prices for petroleum feedstocks while unfinished metals prices increased in large part because of a surge in gold prices. The price index for nonmonetary gold increased 26.7 percent in 2011 as the spot price of gold hit an intraday record of $1,923 per ounce in August. [19]
Prices for each of the major finished goods areas also advanced in 2011, with the price indexes for consumer goods and automotive vehicles recording the largest calendar-year increases since the early 1990s. Consumer goods prices rose 3.2 percent in 2011, the largest calendar-year increase since a 3.5-percent advance in 1990. Highlights included the increase in the index for cotton apparel prices, which rose 10.4 percent over the past year because of record cotton prices, which peaked in March, and the price index for coins, gems, jewelry, and collectables, which advanced 13.3 percent as a result of higher gold prices. Higher demand for passenger cars helped lead automotive vehicle prices up 3.7 percent in 2011, the largest calendar-year advance for that index since a 3.9-percent increase in 1993. [20] Capital goods prices also advanced in 2011, rising 0.9 percent.
The price index for foods, feeds, and beverages increased 6.3 percent in 2011, after a 13.2-percent advance in 2010. As was the case in 2010, higher coffee prices drove the overall rise in foods, feeds, and beverages prices, increasing 41.4 percent, following a 32.7-percent advance the previous year. Unlike 2010, though, when prices trended up throughout the year, the 2011 increase in coffee prices resulted from a 45.9-percent jump over the first 4 months of the year. From April through December, coffee prices fell 3.1 percent. Poor weather in Brazil, Columbia, and Vietnam, the world's three largest coffee producers, led to reduced output in 2010, which influenced prices into 2011. [21] However, improving conditions in the current growing season have halted the increasing price trend for coffee. [22]
Import Prices from China
Import prices from China rose 3.6 percent in 2011, the largest calendar-year advance since the index was first published in December 2003. The 2011 advance followed a 0.8-percent increase in 2010 and a 1.8-percent decline in 2009. On June 19, 2010, the Central Bank of China made an announcement that China would allow the yuan to float against the U.S. dollar. [23] Although prices for imports from China were mostly unchanged in the 3 months immediately following the announcement, the index rose 0.9 percent over the final quarter of 2010 before steadily trending up throughout 2011.
Export Prices
Export prices advanced 3.6 percent in 2011, after rising 6.5 percent the previous year. Similar to the increase for import prices, the increase in export prices in 2011 took place over first 4 months of the year, when export prices rose 4.9 percent. In contrast, the index declined 1.3 percent between April and December. Both agricultural and nonagricultural prices increased in 2011, rising 0.8 percent and 4.0 percent, respectively.
Nonagricultural Export Prices
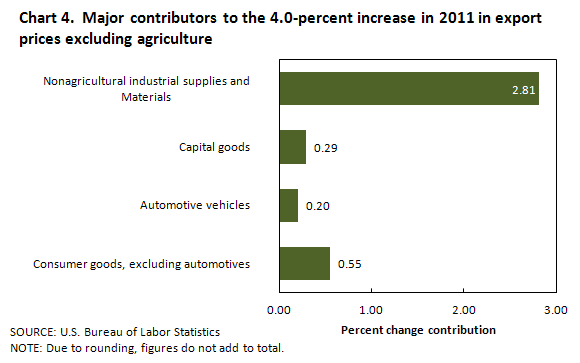
The price index for nonagricultural exports advanced 4.0 percent over the past 12 months, following a 5.1-percent increase in 2010. Nonagricultural prices trended up over the first 3 quarters of 2011 before decreasing 1.7 percent during the final quarter of the year, making it the largest quarterly drop for the index since a 6.0-percent decrease during the fourth quarter of 2008. Chart 4 shows a 7.9-percent increase in the price index for nonagricultural industrial supplies and materials, the largest contributor to the overall advance in nonagricultural export prices, although prices for each of the major finished goods categories rose as well in 2011.
The 2011 increase in nonagricultural industrial supplies and materials prices followed a 13.5-percent rise in 2010, and was driven by a 12.1-percent advance between December 2010 and May. Higher prices for fuel, metals, and chemicals during the first half of 2011 led the increase in the price index for nonagricultural industrial supplies and materials. During the fourth quarter, however, the index fell 4.3 percent.
The price indexes for export consumer goods, automotive vehicles, and capital goods all rose in 2011, increasing 3.6 percent, 2.6 percent, and 0.7 percent, respectively. The advance in consumer goods prices was the largest calendar-year advance for the index since a 3.8-percent rise in 1990, while the 2011 increase in automotive vehicle prices was the largest calendar-year gain since a 2.8-percent advance in 1989.
For more information, contact Edwin Bennion by phone at (202) 691-7142 or by email at bennion.edwin@bls.gov, or David Mead at (202) 691-7154 or mead.dave@bls.gov.
Greater detail on the construction of the import and export price indexes can be found in the Technical Note from the monthly News Release (http://www.bls.gov/news.release/ximpim.tn.htm).
Notes
[1] Luzi Ann Javier, "Corn Advances as Adverse Weather Threatens Crops; Soybeans Gain," Bloomberg Businessweek, February 15, 2011, http://www.businessweek.com/news/2011-02-15/corn-advances-as-adverse-weather-threatens-crops-soybeans-gain.html.
[2] Tony C. Dreibus and Luzi Ann Javier, "Corn Rises to Highest Prices Since 2008 as Wet Weather Threatens Planting," Bloomberg, April 7, 2011, http://www.bloomberg.com/news/2011-04-07/soybeans-gain-on-speculation-supply-to-tighten-as-farmers-switch-to-corn.html.
[3] Thomas Capehart and Edward Allen, "Feed Outlook," (U.S. Department of Agriculture, January 17, 2012), http://usda01.library.cornell.edu/usda/current/FDS/FDS-01-17-2012.pdf.
[4] "U.S. Acreage, Production, Yield, and Farm Price," Feed Grains Database Yearbook Tables, (U.S. Department of Agriculture, Economic Research Service, January 2012), http://www.ers.usda.gov/data/FeedGrains/FeedYearbook.aspx.
[5] Jeff Wilson, "Soybeans Jump to 26-Month High as U.S. Supplies Drop, Global Demand Climbs," Bloomberg, November 9, 2010, http://www.bloomberg.com/news/2010-11-09/soybeans-soar-to-two-year-high-on-improved-demand-for-reduced-u-s-supply.html.
[6] Mark Ash, "Oil Crops Outlook," (U.S. Department of Agriculture, Economic Research Service, October 13, 2011), http://usda01.library.cornell.edu/usda/ers/OCS/2010s/2011/OCS-10-13-2011.pdf.
[7]"U.S. wheat exports by selected destinations," Wheat Data: Yearbook Tables, (U.S. Department of Agriculture, Economic Research Service, December 2011), http://www.ers.usda.gov/data/wheat/YBtable25.asp.
[8] National Cotton Council of America, "Export Rankings Marketing Year 2011," http://www.cotton.org/econ/cropinfo/cropdata/rankings.cfm.
[9] Esteban Balseca and Edwin Bennion, "The Impact of Soaring Cotton Prices on Consumer Apparel Prices," in Focus on Prices and Spending, (U.S. Bureau of Labor Statistics, August 2011), http://www.bls.gov/opub/focus/volume2_number5/ipp_2_5.pdf.
[10] "Prices Stabilize, China but Not Others Return to U.S. Market," in Cotton: World Markets and Trade, (U.S. Department of Agriculture, Foreign Agricultural Service, December 2011), http://www.fas.usda.gov/cotton/circular/2011/Dec/cotton_full12-11.pdf.
[11] Elizabeth Holmes, "Tumble in Cotton Prices, New Wrinkle for Apparel Makers," The Wall Street Journal, July 22, 2011, http://online.wsj.com/article/SB10001424053111903554904576458270983393048.html.
[12] "Oil Market Report," (International Energy Agency, February 10, 2011), omrpublic.iea.org/omrarchive/10feb11full.pdf.
[13] "Oil Market Report," (International Energy Agency, May 12, 2011), omrpublic.iea.org/omrarchive/12may11full.pdf.
[14] "Oil Market Report," (International Energy Agency, April 12, 2011), omrpublic.iea.org/omrarchive/12apr11full.pdf.
[15] International Energy Agency, Oil Market Report, June 16, 2011, omrpublic.iea.org/omrarchive/16jun11full.pdf.
[16] "Oil Market Report," (International Energy Agency, December 13, 2011), omrpublic.iea.org/omrarchive/13dec11full.pdf.
[17] "Trade Weighted U.S. Dollar Index: Major Currencies," (St. Louis Federal Reserve, January 2012), http://research.stlouisfed.org/fred2/series/DTWEXM?cid=105. Note that oil is priced in U.S. dollars, so when the value of the U.S. dollar increases, the price of oil becomes cheaper relative to that currency, all else being held equal.
[18] "Storage Inventories," in Natural Gas Year-End-Review, (U.S. Energy Information Administration, December 2011), http://www.eia.gov/naturalgas/review/storage.cfm. Note that the data dates back to 1993.
[19] Alix Steel, "Gold Prices Poised for 11th Year of Gains in 2012," The Street, December 22, 2012, http://www.thestreet.com/print/story/11351700.html.
[20] Bernie Woodall and Ben Klayman, "Auto Sales Rebound, Allaying Recession Fear," Reuters, October 3, 2011, http://www.reuters.com/article/2011/10/03/us-autos-sales-idUSTRE78S6BG20111003.
[21] Daniel Harrington, "Coffee Price in 2011," Espresso & Coffee Guide, February 8, 2011, http://www.espressocoffeeguide.com/2011/02/coffee-price-in-2011/.
[22] "Coffee Prices Dip From Record Highs as Supply Increases," Business Daily, January 18, 2012.
[23] Tony Zhu, "China's RMB Hits Record High of 6.3009 per U.S. Dollar", Business China, December 30, 2011.