
Focus on Prices and Spending | Producer Price Index | Volume 2, Number 14
Current Price Topics: The 2012 PPI Weight Update: How and why does BLS update revenue weights?
With the release of January 2012 Producer Price Index (PPI) data by the Bureau of Labor Statistics (BLS) in February 2012, the PPI will begin using 2007 value-of-shipments (VOS) data as the weight basis for the PPI. (The PPI had used 2002 shipment data as the basis for its index weights from 2007 through 2011.)
The PPI is a family of indexes that represents the marketed output of domestic industries. Representation is based primarily on VOS data from the U.S. Census Bureau’s Economic Census (which includes the census of manufacturers, services, and mining) and the Census of Agriculture conducted by the U.S. Department of Agriculture (USDA). These censuses occur every 5 years (in years that end with a 2 or 7) and provide a broad measure of business activity across the U.S. economy. As the data reflect important technological advancements and changes in demand, BLS updates the value weights used to calculate Producer Price Indexes every 5 years to reflect recent production and marketing patterns. Using the updated census data, PPI weights are revised to reflect the 2007 marketed output of production. Even though the basic structure of the commodity and industry indexes does not change, aggregate indexes are impacted in a manner reflective of the relative gains and losses in the value of shipments between the two weight reference periods. (Note that PPI weights also fluctuate each month, but to a lesser extent, due to pricing trends in the economy.[1])
The industry and commodity structures in the PPI employ different VOS Census data for the weight revision. The PPI industry structure, classified according to the North American Industry Classification System (NAICS), uses Census made in industry value-of-shipments data. These data reflect the value of shipments from establishments classified within specific industries and are broken into primary products (products the establishments manufacture that are considered to be in their main line of business), secondary products (products the establishments manufacture that are classified as primary in another industry), and miscellaneous receipts (revenue not derived from product sales but from service activities classified as primary in other industries). PPI commodity weights are based on Census Wherever Made value-of-shipments data. These data are organized by product and document the value of shipments of a product regardless of the industry of its producer. Value-of-shipments data from the Census Bureau and the USDA are located on their respective websites.[2]
A review of the leading weight shifts between 2002 and 2007 reveals that gains were made in petroleum-related NAICS industries: petroleum refineries (NAICS 324110), crude petroleum and natural gas extraction (NAICS 211111), petrochemical manufacturing (NAICS 325110), plastic material and resin manufacturing (NAICS 325211), support activities for oil and gas operations (NAICS 213112), and drilling oil and gas wells (NAICS 213111) and basic materials industries, such as iron and steel mills (NAICS 331111), construction machinery manufacturing (NAICS 333120), and ready-mix concrete manufacturing (NAICS 327320). Higher value of shipments in these economically sensitive industries were driven, in part, by economic growth, as gross domestic product (GDP) in the United States grew at a 2.7-percent average annual rate between 2002 and 2007.[3] Higher crude petroleum shipment values were chiefly a result of rising prices between the two weight reference periods: crude petroleum prices (measured per oil barrel, bbl) climbed from an average of $26/bbl in 2002—following the 2001 recession and the 9/11 attacks—to $72/bbl in 2007.[4] From 2002 to 2007 oil prices were driven by a 10-percent increase in global oil demand, due to strong worldwide economic growth, tight supply and inventories, and geopolitical tensions.[5] Shipment values of basic materials and construction equipment also surged from 2002 to 2007, as the housing bubble, which peaked in 2007, created exceptional demand for construction-related products during this period.[6]
By contrast, weight declines were mainly in industries in the apparel manufacturing subsector (NAICS 315) and in electron tube manufacturing (NAICS 334411). Over the last decade, apparel companies have responded to competitive pressures by shifting production to less costly foreign operators in developing markets. As foreign production is not considered in scope, this shift has led to reductions of more than 50 percent in the value of shipments for many apparel industries.[7] Electron tube manufacturers have been affected adversely by the development of liquid crystal display (LCD), plasma, and other flat panel displays that are both lower in cost and superior in quality. The subsequent drop in demand for technologically obsolete cathode ray tubes has led to a significant decrease in shipments from electron tube manufacturers.[8]
Current Price Trends: Producer Price Index Price Highlights for 2011
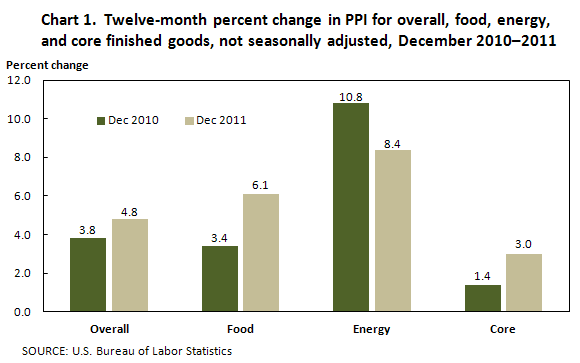
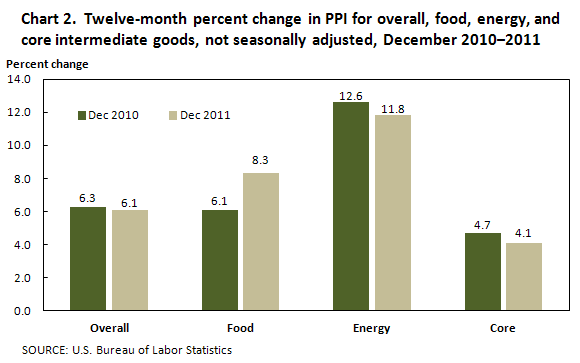
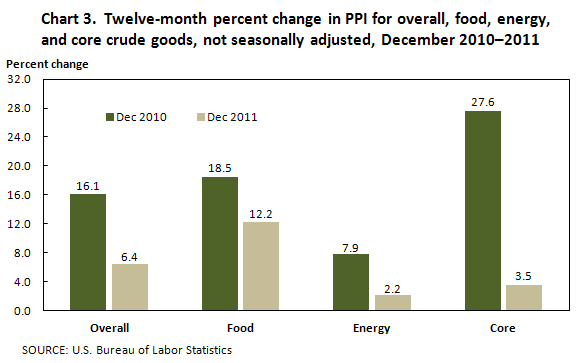
The PPI for finished goods rose 4.8 percent in 2011, compared with a 3.8-percent advance in 2010.[9] This faster rate of increase was led by prices for finished goods less foods and energy, which moved up 3.0 percent in 2011, after inching up 1.4 percent a year earlier. In addition, prices for finished consumer foods climbed 6.1 percent, following a 3.4-percent rise in 2010. In contrast, the index for finished energy goods advanced at a slower rate in 2011 than in the prior year—8.4 percent—compared with 10.8 percent. (See chart 1.) At the earlier stages of processing, prices received by manufacturers of intermediate goods increased 6.1 percent in 2011, subsequent to a 6.3-percent gain in 2010, as the indexes for intermediate goods less foods and energy and for intermediate energy goods moved up at slower rates, while prices for intermediate foods and feeds rose more than in the preceding year. (See chart 2.) Crude goods inflation slowed to 6.4 percent, from 16.1 percent in the previous year, as the indexes for core[10] crude goods, foodstuffs and feedstuffs, and energy goods all advanced less than a year earlier. (See chart 3.)
Economic background
From 2010 to 2011, within each PPI stage of processing, price movements for goods other than foods and energy accounted for the majority of the shift in producer inflation. After surging 27.6 percent in 2010, the index for core crude goods advanced at a much slower rate in the first half of 2011 and fell in the second half of the year. Smaller increases and outright declines in prices for ferrous scrap, nonferrous ore and scrap, and wastepaper led the deceleration in prices for core crude goods. Contributing to these changes in inflation, GDP expansion in 2010 was replaced in 2011 by economic uncertainty. Weakening GDP growth in both the U.S. and Europe,[11] lingering high unemployment in the U.S.,[12] and the European financial crisis weakened pricing for many basic commodities. The index for core intermediate goods also rose less in 2011 than in 2010, as inflation slowed for less highly processed materials used for nondurable and durable goods manufacturing. In contrast, prices for more highly processed manufacturing and construction components, as well as supplies for business, climbed at higher rates, compared with a year earlier. Likewise, the finished core PPIs for both capital equipment and finished consumer goods less foods and energy moved up at quicker rates than in 2010.[13]
In the food sector, after surging in 2010 and continuing their rise in the first half of 2011, prices for grains and soybeans fell in the latter half of the year. Expectations regarding yearend production and storage for corn, wheat, and soybeans improved steadily as the 2011 harvest approached. In the corn sector, harvested acreage increased 3.1 percent to nearly 84 million acres, while yield per acre decreased 3.7 percent to 147.2 bushels per acre, resulting in a 0.7-percent decline in total corn production to 12.36 billion bushels.[14] In the wheat market, a smaller U.S. harvest in 2011—harvested acreage fell 4.0 percent, yield per acre shrank 5.6 percent, and total production dropped 9.4 percent—was outweighed by increased production around the globe,[15] as the wheat harvests in Kazakhstan and Brazil were particularly successful.[16] The market for soybeans mirrored the wheat market: in the United States, harvested acreage, yield per acre, and total production also moved down, while Brazilian production remained ample.[17] Price advances for prepared animal feeds and slaughter cattle also moderated in 2011; however, prices for more highly processed foods—such as cheese products, processed fruits and vegetables, beef, chicken, and bakery products—did not respond to easing price pressure at earlier production stages.
In the energy sector, the rate of increase in crude petroleum prices slowed to 14.8 percent in 2011 from 24.8 percent a year earlier. Prices for refined petroleum products rose at a slightly slower rate than in 2010. Domestic crude oil production advanced 2.7 percent in 2011 to an average of 5.6 million barrels per day, while average daily net imports fell 2.7 percent to 8.8 million barrels. After adjustments and changes to stockpiles, average crude oil inputs to refineries edged up 0.6 percent to 14.7 million barrels per day in 2011.[18] For finished motor gasoline, average daily production moved down 1.9 percent to 8.9 million barrels.[19] In 2011, the United States was a net exporter of refined petroleum products.[20] In the natural gas sector, underground storage of wellhead natural gas ended the year at 3,472 billion cubic feet; an increase of 375 billion cubic feet from the end of the previous year and 458 billion cubic feet above its 5-year average.[21] The PPI for wellhead natural gas fell 19.3 percent in 2011, after declining 9.4 percent in the preceding year. Utility natural gas prices moved down 5.3 percent, after inching up 0.2 percent in 2010.
Finished goods
Leading the 2011 acceleration in the finished goods index, prices for finished goods less foods and energy climbed 3.0 percent, after edging up 1.4 percent in 2010. Nearly half of this faster rate of advance can be traced to prices for motor vehicles. The index for light motor trucks moved up 3.2 percent in 2011, after inching down 0.3 percent in the previous year, and the index for passenger cars increased 2.5 percent, after falling 2.3 percent in 2010. Prices for commercial furniture also advanced in 2011, following declines in the preceding year. The index for apparel and other fabricated textile products rose more than in 2010. Conversely, cigarette prices climbed 4.9 percent in 2011, compared with a 7.9-percent gain in the prior year. The pharmaceutical preparations index also increased less than a year earlier.
Similar to the finished core index, prices for finished consumer foods rose more in 2011 than a year earlier, 6.1 percent, compared with 3.4 percent. The index for processed fruits and vegetables climbed 8.0 percent, following a 0.7-percent decline in 2010. Prices for natural, processed, and imitation cheese and for peanut butter also turned up in 2011. The index for bakery products increased more than in the preceding year. In contrast, prices for melons dropped 64.2 percent, following a 199.1-percent surge in 2010, while the pork index advanced significantly less in 2011 than in the previous year.
Prices for finished energy goods rose 8.4 percent in 2011, following a 10.8-percent increase in 2010. About three-fourths of this deceleration is attributable to the gasoline index, which advanced 13.1 percent, after climbing 18.5 percent a year earlier. Prices for diesel fuel and home heating oil also moved up less in 2011 than in the prior year. The index for residential natural gas fell more than in 2010. Conversely, prices for liquefied petroleum gas and finished lubricants increased more in 2011 than a year earlier.
Intermediate goods
The Producer Price Index for intermediate materials for further processing rose 6.1 percent in 2011, following a 6.3-percent advance in 2010. This broad-based increase was driven by higher prices for intermediate materials less foods and energy and for intermediate energy materials. An advance in the index for intermediate foods and feeds also contributed, but to a lesser extent, to the rise in intermediate goods prices.
Prices for intermediate materials less foods and energy increased 4.1 percent in 2011, after rising 4.7 percent in 2010. The index for primary basic organic chemicals moved up 6.1 percent, following an 18.7-percent jump in the previous year. Prices for paperboard, nonferrous mill shapes, primary nonferrous metals, nonferrous wire and cable, and paper boxes and containers declined in 2011, following gains a year earlier. The index for inedible fats and oils rose less than in 2010. Conversely, the index for hot rolled steel sheet and strip climbed 14.4 percent in 2011, compared with a 2.5-percent advance in the previous year.
The index for intermediate energy materials moved up 11.8 percent in 2011, subsequent to a 12.6-percent gain a year earlier. In 2011, higher prices for gasoline, diesel fuel, jet fuel, and asphalt outweighed lower prices for utility natural gas.
Prices for intermediate foods and feeds climbed 8.3 percent in 2011, subsequent to a 6.1-percent gain a year earlier. Leading this acceleration, the index for natural, processed, and imitation cheese jumped 17.8 percent, following a 1.4-percent decrease in 2010. Prices for confectionery materials and for processed fruits and vegetables also turned up in 2011. In contrast, the rate of increase in prices for pork products slowed to 7.1 percent, compared with a 22.2-percent surge a year earlier. The indexes for prepared animal feeds and flour also increased less than they had in 2010.
Crude goods
The Producer Price Index for crude materials for further processing advanced 6.4 percent in 2011, compared with a 16.1-percent increase in the previous year. This deceleration was broad based, with prices for crude nonfood materials less energy, crude foodstuffs and feedstuffs, and crude energy goods all rising less than they had in 2010.
In 2011, the index for crude nonfood materials less energy moved up 3.5 percent, following a 27.6-percent jump a year earlier. Iron and steel scrap prices advanced 11.1 percent, after climbing 38.9 percent in 2010. Slower rates of increase in the indexes for nonferrous metal ores, corn, hides and skins, and raw cotton also were significant factors in the crude core deceleration. Prices for wastepaper, nonferrous scrap, and wheat turned down in 2011, after rising in the prior year. In contrast, the index for iron ores jumped 20.5 percent, subsequent to a 3.8-percent rise in 2010.
The index for crude foodstuffs and feedstuffs increased 12.2 percent in 2011, compared with an 18.5-percent climb in the previous year. Corn prices accounted for nearly eighty percent of this deceleration, moving up 7.4 percent after advancing 53.3 percent in 2010. The index for slaughter cattle also increased less in 2011 than it had in the prior year. Prices for soybeans and wheat turned down, after rising in 2010. In contrast, the fluid milk index jumped 18.6 percent, subsequent to a 1.0-percent advance a year earlier. Prices for alfalfa hay also rose more than they had in 2010.
Crude energy goods prices moved up 2.2 percent in 2011, following a 7.9-percent increase a year earlier. The index for crude petroleum accounted for over 60 percent of this deceleration, advancing 14.8 percent, after a 24.8-percent climb in 2010. Natural gas prices declined more than they had in the previous year. Conversely, the coal index rose 9.0 percent in 2011, subsequent to a 4.6-percent advance in 2010.
Trade industries
In 2011, the increase in the Producer Price Index for the net output of total trade industries accelerated to 3.4 percent, from 1.3 percent in 2010. (Trade indexes measure changes in margins received by wholesalers and retailers.) Leading this faster rate of advance, the margin index for gasoline stations jumped 17.0 percent, after dropping 17.7 percent in 2010. Margins received by merchant wholesalers of durable goods also turned up in 2011. The margin index for non-discount department stores declined less than it had in the previous year. In contrast, margins received by merchant wholesalers of nondurable goods advanced at a slower rate, climbing 0.6 percent, subsequent to a 3.6-percent increase in 2010. The index for discount department stores also rose less in 2011, and margins received by warehouses and supercenters turned down, after rising in 2010.
Transportation and warehousing industries
The Producer Price Index for the net output of transportation and warehousing industries accelerated to 6.1 percent, from 4.1 percent in 2010. Prices received by the scheduled passenger air transportation industry group led this faster rate of increase, climbing 9.7 percent compared with a 3.1-percent rise a year earlier. The industry indexes for line-haul railroads, general freight trucking, and couriers also advanced more than they had in 2010. Conversely, the index for pipeline transportation of crude oil fell 4.4 percent, subsequent to a 37.9-percent jump in 2010. Prices received by the industry for deep sea freight transportation also turned down, after advancing in the prior year.
Traditional service industries
In 2011, the Producer Price Index for the net output of total traditional service industries climbed 1.9 percent; the same rate as it had in 2010. In 2011, increases in the indexes for insurance carriers and related activities, general medical and surgical hospitals, commercial banking, offices of lawyers, offices of physicians, and engineering services outweighed lower prices received by the passenger car rental industry.
Notes
[1] Chapter 14, Producer Prices, BLS Handbook of Methods, (U.S. Bureau of Labor Statistics), pp. 6-7, http://www.bls.gov/opub/hom/pdf/homch14.pdf.
[2] See 2007 Economic Census, (U.S. Census Bureau), http://www.census.gov/econ/census07/. Also, see 2007 Census Report, volume 1 (U. S. Department of Agriculture), http://www.agcensus.usda.gov/Publications/2007/Full_Report/index.asp.
[3] National Income and Product Accounts Tables (U.S. Bureau of Economic Analysis), http://www.bea.gov/iTable/iTable.cfm?ReqID=9&step=1.
[4] Spot Prices for Crude Oil and Petroleum Products, Table 1.1.1, Annual data (U.S. Energy Information Administration), http://www.eia.gov/dnav/pet/pet_pri_spt_s1_a.htm.
[5] International Petroleum (Oil) Consumption, Table 1.7 (U.S. Energy Information Administration), http://www.eia.gov/emeu/international/oilconsumption.html. Short-Term Energy Outlook Supplement: "Why Are Oil Prices So High?" November 2007 (U.S. Energy Information Administration), http://www.eia.gov/forecasts/steo/special/pdf/2007-oil-prices.pdf.
[6] Median and Average Sales Prices of New Homes Sold in United States (U.S. Census Bureau), (http://www.census.gov/const/uspriceann.pdf).
[7]Economic Classification Policy Committee (ECPC) Recommendation for Manufacturing Industry Reductions in North American Industry Classification System (NAICS) Revisions for 2012 (U.S. Census Bureau), pp. 8-10, http://www.census.gov/eos/www/naics/fr2010/Manufacturing_Industry_Reductions.pdf.
[9] Price movements for PPIs described in this article include preliminary data for the months of September 2011 through December 2011, which were calculated under the 2002 weight basis. All PPI data are recalculated 4 months after original publication, to reflect late data received from survey respondents. In addition, seasonally adjusted PPIs are recalculated on an annual basis for 5 years, to reflect more recent seasonal patterns. Most of the price movements described in this section are not-seasonally adjusted 12-percent changes.
[10] Within the PPI stage-of-processing structure, indexes for goods other than foods and energy commonly are referred to as the core indexes.
[11] Gross Domestic Product: Third Quarter 2011 (Third Estimate), BEA 11–63, Bureau of Economic Analysis, December 22, 2011, at http://www.bea.gov/newsreleases/national/gdp/2011/pdf/gdp3q11_3rd.pdf, p. 6. After rising 3.0 percent in 2010, in the first three quarters of 2011, GDP advanced at annualized rates of 0.4, 1.3, and 1.8 percent. Data for the final quarter of 2011 were posted Jan. 27, 2012, too late to be included in this review. The Eurostat homepage is located at http://epp.eurostat.ec.europa.eu/portal/page/portal/eurostat/home. A link in the left-hand sidebar labeled "Real GDP growth rate," http://epp.eurostat.ec.europa.eu/tgm/table.do?tab=table&init=1&plugin=1&language=en&pcode=tsieb020 takes the user to a table of GDP figures.
[12] The Employment Situation – December 2011, USDL-12-0012 (U.S. Bureau of Labor Statistics, January 6, 2012), at http://www.bls.gov/news.release/archives/empsit_01062012.pdf, chart 1, p. 1.
[13] More highly processed intermediate and finished goods commonly exhibit price movements that are somewhat different from price movements for less-processed goods, because basic material costs tend to be a smaller portion of total costs for producers of more highly processed goods than for manufacturers of less-processed goods. Contracts and escalation agreements also can delay or mitigate the pass-through effect of early-stage price volatility at successive stages of processing.
[14] Crop Production, 2011 Summary, ISSN: 10577823, Jan. 12, 2012, U. S. Department of Agriculture, National Agricultural Statistics Service, pp. 8-9, at http://usda01.library.cornell.edu/usda/nass/CropProdSu//2010s/2012/CropProdSu-01-12-2012.pdf.
[15] Ibid, pp. 18-19.
[16] Wheat Outlook, WHS-12a, Jan. 17, 2012, U. S. Department of Agriculture, Economic Research Service, p. 5, at http://usda01.library.cornell.edu/usda/ers/WHS//2010s/2012/WHS-01-17-2012.pdf.
[17] Crop Production, 2011 Summary, ISSN: 10577823, Jan. 12, 2012, U. S. Department of Agriculture, National Agricultural Statistics Service, pp. 42-43, at http://usda01.library.cornell.edu/usda/nass/CropProdSu//2010s/2012/CropProdSu-01-12-2012.pdf. Oil Crops Outlook, OCS-12a text, Jan. 13, 2012, U. S. Department of Agriculture, Economic Research Service, pp. 1-5, at http://usda01.library.cornell.edu/usda/ers/OCS//2010s/2012/OCS-01-13-2012.pdf.
[18] Weekly Petroleum Status Report, DOE/EIA-0208(2011-52), Jan. 5, 2012, U. S. Department of Energy, Energy Information Administration, p. 1, at http://www.eia.gov/pub/oil_gas/petroleum/data_publications/weekly_petroleum_status_report/historical/2012/2012_01_05/pdf/wpsrall.pdf.
[19] Ibid, p. 1.
[20] Ibid, p. 13.
[21] Weekly Natural Gas Stage Report, U. S. Department of Energy, Energy Information Administration, web-based release, updated weekly, at http://ir.eia.gov/ngs/ngs.html.