
Focus on Prices and Spending | Consumer Price Index | Volume 2, Number 15
Current Price Topics: The Experimental Consumer Price Index for Older Americans (CPI-E)
The Bureau of Labor Statistics (BLS) calculates official price indexes for two population groups. One is the Consumer Price Index for All Urban Consumers (CPI-U), which represents the spending habits of about 88 percent of the population of the United States.[1] The other is the CPI for Urban Wage Earners and Clerical Workers (CPI-W), a subset of the CPI-U population, which represents about 29 percent of the U.S. population.
BLS also calculates an experimental Consumer Price Index by using households whose reference person or spouse is 62 years of age or older. Commonly called the CPI for the elderly, or CPI-E, this experimental price index rose 142.8 percent from December 1982 to December 2011, compared with increases of 131.2 percent and 126.7 percent for the CPI-U and CPI-W, respectively. These figures translate into average annual increases of 3.1 percent for the CPI-E and 2.9 percent for both the CPI-U and CPI-W.[2]
Methodology and limitations of the CPI-E
Although the CPI-E indicates a slightly higher overall inflation rate for older Americans compared with the official CPIs, it is important to note that the CPI-E is an experimental index, so any conclusions drawn from it should be used with caution. There are several reasons that the CPI-E is considered an experimental index.
First, the scope of the CPI-E is significantly narrower than that of the CPI-U: in 2009–2010, approximately 24 percent of all consumer units met the CPI-E's definition of having a reference person or spouse 62 years of age or older. As a result, because the CPI-E sample is relatively small, the expenditure weights used for that index are subject to a larger sampling error than those used for the official indexes.
Second, the geographic areas, and the retail outlets within those areas, used for the CPI-E are the same as those used for the CPI-U. Retail outlets are selected for pricing in the CPI-U on the basis of data reported in a survey representing all urban households. The CPI-E uses that same retail outlet sample. Thus, the outlets may not be representative of the location and types of stores used by the elderly population.
Third, the sample of items used for the CPI-E is the same sample used for the official indexes. Because the specific items sampled within selected outlets are chosen on the basis of total sales in the outlet—and not sales to the elderly—the items selected for pricing in each outlet may not be representative of the CPI-E population. For example, the CPI sample for prescription drugs in a pharmacy is designed to be representative of all prescriptions drugs sold at that pharmacy, whereas a sample designed to represent prescription drug purchases by the elderly would likely include a different range of those items.
Finally, the prices used in the CPI-E are the same as those used for the official indexes. For example, senior-citizen discount rates are used in the CPI only in proportion to their use by the urban population as a whole. These prices, presumably, would be more widespread in an index designed specifically for older Americans.
Relative behavior of price indexes
From December 1982 through December 2011, the all-items CPI-E rose at an annual average rate of 3.1 percent, compared with increases of 2.9 percent for both the CPI-U and CPI-W. There are several reasons that older Americans faced slightly higher inflation rates over the past 29 years. First, older Americans devote a substantially larger share of their total budgets to medical care. For example, as shown in table 1, the share of expenditures on medical care by the CPI-E population is roughly double that of either the CPI-U population or the CPI-W population. In addition, over the 1983–2011 period, medical care inflation increased significantly more than inflation for most other goods and services (5.1 percent annually for medical care, compared with 2.8 percent for all items less medical care). In fact, medical care inflation has outpaced overall inflation in each of the last 29 years, save for 1996.
| Expenditure group | CPI-U | CPI-W | CPI-E |
|---|---|---|---|
All items |
100 | 100 | 100 |
Food and beverages |
15 | 15.7 | 12.8 |
Food at home |
8.5 | 9.3 | 7.9 |
Food away from home |
5.6 | 5.5 | 4.2 |
Alcoholic beverages |
0.9 | 0.9 | 0.7 |
Housing |
40.2 | 39.2 | 44.5 |
Shelter |
30.9 | 30 | 34.3 |
Rent of primary residence |
6.4 | 8.8 | 3.8 |
Owners' equivalent rent |
23.5 | 20.5 | 29.3 |
Apparel |
3.5 | 3.6 | 2.4 |
Transportation |
16.5 | 18.7 | 14.5 |
Motor fuel |
5.4 | 6.9 | 4.1 |
Medical care |
6.9 | 5.6 | 11.3 |
Medical care commodities |
1.7 | 1.3 | 3 |
Medical care services |
5.2 | 4.3 | 8.3 |
Recreation |
5.9 | 5.5 | 5.3 |
Education and communication |
6.7 | 6.7 | 3.8 |
College tuition and fees |
1.7 | 1.4 | 0.4 |
Other goods and services |
5.3 | 5.1 | 5.4 |
Tobacco and smoking products |
0.8 | 1.2 | 0.6 |
Second, older Americans spend relatively more on shelter (see table 1), and during the last 29 years shelter costs have modestly outpaced overall inflation. Thus, the medical care and shelter components account for a significant portion of the difference between the higher rate of increase measured for the CPI-E relative to the two official indexes during the 1983–2011 period.
Although the CPI-E generally outpaced the official measures of inflation over the 1983–2011 timeframe, recent trends show different results. From 2006 to 2011, both the all-items CPI-E and the CPI-U rose at an average annual rate of 2.3 percent, while the CPI-W increased 2.4 percent. This turnaround was caused primarily by changes in the relative inflation rates of medical care and shelter, compared with the overall inflation rate. Specifically, the gap between medical care inflation and overall inflation has generally fallen since 2005, and shelter inflation has been rising slightly more slowly than overall inflation over the 2006–2011 period.
The CPI and its relationship to Social Security benefits
The Social Security Administration uses changes in the CPI-W to determine annual cost-of-living adjustments (COLAs) for beneficiaries. Some policymakers have advocated using the CPI-E instead, arguing that the CPI-W (which represents the spending patterns of wage-earner and clerical workers) excludes the experience of families whose primary source of income is from retirement pensions.
That said, it is important to note that the CPI-E population and those receiving Social Security benefits are not identical. First, the population covered by the CPI-E includes persons 62 years of age and older. Many Social Security beneficiaries, however, are younger than 62 and receive benefits because they are surviving spouses or minor children of covered workers or because of disability. The spending patterns of this younger group are excluded in determining the expenditure weights for the CPI-E. Second, a substantial number of persons 62 years of age and older—especially those 62 to 64 years old—do not receive Social Security benefits at all. Although these older consumers are included in the CPI-E population, many of them likely would be excluded from an index defined expressly to reflect the experience of Social Security pensioners.
In short, an index designed specifically to measure price change for Social Security beneficiaries (i.e., one that excludes older people who are not receiving benefits, but includes younger persons receiving survivor and disability benefits) might show price movements that differ somewhat from those captured by the CPI-E.
Conclusions
For most of the period since 1982, the CPI-E rose, on average, somewhat more than the CPI-U and the CPI-W. In recent years, however, that has not been the case. Because the medical care and shelter components of the CPI have a substantially larger relative weight in the experimental CPI-E compared with the CPI-U or CPI-W, these items tend to have a greater effect on the elderly population than on the populations covered by the CPI-U and CPI-W.
Some policymakers have argued that, because the CPI-W excludes the experience of families whose primary source of income is from retirement pensions, the CPI-E is a more appropriate measure of changes in the cost of living for pensioners. Still, the experimental CPI-E has limitations as an estimate of the inflation rate experienced by older Americans, and any conclusions drawn from it should be used with caution.
Current Price Trends
All items
The U.S. all items Consumer Price Index for all Urban Consumers (CPI-U) decreased at a seasonally adjusted annualized rate of 0.4 percent during the fourth quarter of 2011. This drop follows successive increases in the all items CPI-U for the previous three quarters of 2011. The all items CPI-U rose 3.0 percent from December 2010 to December 2011. The 5-year annualized change in this index from December 2006 to December 2011 was 2.3 percent.
The fourth-quarter decrease in the all items CPI-U is attributed largely to a sharp decrease in the energy index during the last 3 months of 2011. The energy index decreased at a seasonally adjusted annualized rate of 18.0 percent during the fourth quarter. By contrast, the food index increased 1.6 percent on a seasonally adjusted annualized basis. Excluding food and energy, the CPI-U increased at a seasonally adjusted annualized rate of 1.8 percent during the fourth quarter of 2011. (See chart 1.)
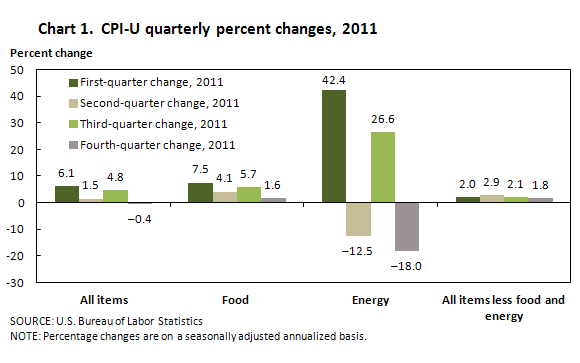
Energy
Price movements in the energy index remained volatile during the last quarter of 2011. The energy index decreased at a seasonally adjusted annualized rate of 18.0 percent during the fourth quarter, following an increase of 26.6 percent in the third quarter of 2011. Annually, the index increased 6.6 percent from December 2010 to December 2011. The 5-year annualized change in the energy index from December 2006 to December 2011 was 4.6 percent.
The marked decrease in the energy index was due to large fourth-quarter decreases in the indexes for utility (piped) gas service and gasoline (all types), which decreased at seasonally adjusted annualized rates of 28.3 percent and 26.2 percent, respectively. In contrast, two components of the energy index—fuel oil and other fuels (which is not seasonally adjusted) and electricity—increased at annualized rates of 7.1 percent and 2.3 percent, respectively, during the fourth quarter of 2011.
Changes in the energy index are explained chiefly by similar price movements in the gasoline (all types) index, which exhibited marked reversals in price movements between each quarter of 2011. Despite decreasing on a seasonally adjusted annualized basis during the fourth quarter, the gasoline (all types) index increased 9.9 percent from December 2010 to December 2011. The 5-year annualized change in this index from December 2006 to December 2011 was 7.2 percent.
Also of note is the continued decrease in the utility (piped) gas service index. Although the index exhibited three successive quarters of seasonally adjusted annualized increases prior to the fourth-quarter decrease, it decreased 3.7 percent from December 2010 to December 2011. Likewise, the 5-year annualized change in this index from December 2006 to December 2011 was a decrease of 4.2 percent.
Food
Increases in the food CPI-U slowed to a seasonally adjusted annualized rate of 1.6 percent during the fourth quarter of 2011, after increasing at a seasonally adjusted annualized rate of 5.8 percent for the first 9 months of 2011. From December 2010 to December 2011, the index increased 4.7 percent. The 5-year annualized change in the food index from December 2006 to December 2011 was 3.3 percent.
The food at home component increased at a seasonally adjusted annualized rate of 0.9 percent during the last 3 months of 2011. This moderate quarterly increase was not due to uniformly moderate changes in the subcategories of the index, but is rather explained by offsetting quarterly price movements in these subcategories. For example, the meats, poultry, fish, and eggs component increased at a seasonally adjusted rate of 4.5 percent. Both the cereal and bakery products index and the nonalcoholic beverages and beverage materials index increased at a seasonally adjusted annualized rate of 4.0 percent, and the other food at home index increased at a seasonally adjusted annualized rate of 2.8 percent. In contrast, the quarterly decreases in the fruits and vegetables and dairy and related products indexes, which declined at seasonally adjusted annualized rates of 10.8 percent and 1.7 percent, provided the resulting offset for the food at home component.
Within the dairy and related products index, the milk index moved from successive double-digit increases for each of the first three quarters of 2011 to a seasonally adjusted annualized decrease of 6.0 percent during the fourth quarter. This was the first quarterly decrease in the milk index since the third quarter of 2009.
By contrast, the coffee index, which is a component of the nonalcoholic beverages and beverage materials index, continued the trend of quarterly price increases. The index increased 12.5 percent during the fourth quarter of 2011, on a seasonally adjusted annualized basis. The last quarterly decrease in the coffee index occurred during the second quarter of 2010.
The food away from home index, which is not seasonally adjusted, increased 2.4 percent on an annualized basis during the fourth quarter of 2011. This rise follows an annualized increase of 3.1 percent for the first 9 months of 2011. The 5-year annualized change in the food away from home index from December 2006 to December 2011 was 3.0 percent.
All items less food and energy
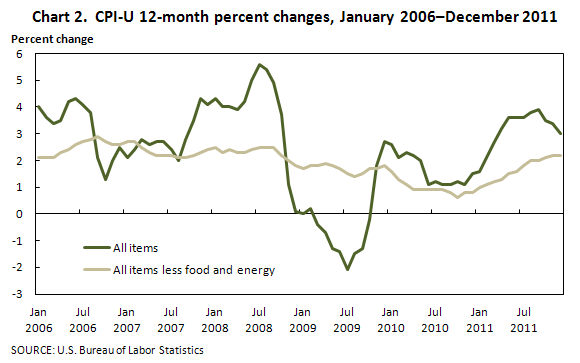
The all items less food and energy CPI-U increased at a seasonally adjusted annualized rate of 1.8 percent during the fourth quarter of 2011, the same as its 5-year trend from December 2006 to December 2011. After the 12-month change in this index reached a historic low of 0.6 percent in October 2010, the annual rate of change in the index slowly increased to 2.2 percent in December 2011. (See chart 2.)
The housing index increased 1.4 percent on a seasonally adjusted annualized basis during the fourth quarter of 2011, with the shelter component increasing an annualized 2.1 percent over the same period.
Price movements in the rent of primary residence index continued to accelerate during the fourth quarter of 2011, rising at a seasonally adjusted annualized rate of 3.5 percent, following an annualized increase of 2.1 percent during the first 9 months of the year. The tenants' and household insurance index, which is not seasonally adjusted, also accelerated during the last quarter of the year, increasing at an annualized rate of 5.0 percent; this rise follows a 9-month annualized increase of 1.8 percent ending in September 2010.
Price movements in the owners' equivalent rent of primary residence index slowed to a seasonally adjusted annualized quarterly increase of 2.1 percent during the fourth quarter of 2011, from 2.4 percent during the third quarter, but remained above the seasonally adjusted annualized rate of 1.6 percent for the first 9 months of the year.
In contrast to the quarterly price increases in the aforementioned shelter components, the lodging away from home component of the shelter index decreased at a seasonally adjusted annualized rate of 7.8 percent during the fourth quarter of 2011. The index has now decreased for two consecutive quarters.
The transportation index decreased 10.2 percent on a seasonally adjusted annualized basis during the fourth quarter of 2011. This quarterly decrease is explained by price movements in the new and used motor vehicles and motor fuel components of the index, both of which also showed fourth-quarter decreases. The motor fuel index, which is greatly influenced by gasoline price movements, decreased at a seasonally adjusted annual rate of 26.1 percent. The new and used motor vehicles index decreased 4.5 percent during the quarter on a seasonally adjusted annualized basis. All components of this index exhibited fourth-quarter decreases, except for the car and truck rental index.
The medical care index increased at a seasonally adjusted annualized rate of 5.1 percent during the fourth quarter of 2011. All components of the index exhibited fourth-quarter increases, except for the eyeglasses and eye care index, which decreased 4.5 percent on a seasonally adjusted annualized basis. Medical care services increased at a seasonally adjusted annualized rate of 5.9 percent during the fourth quarter. Year to year, this index rose 3.6 percent from December 2010 to December 2011, and an annualized 3.8 percent from December 2006 to December 2011.
The apparel index showed three consecutive quarters of price increases, the last of which, during the fourth quarter of 2011, was a seasonally adjusted annualized rate of 3.7 percent. The rate of increase, however, has slowed in each successive quarter since the second quarter of 2011. The men's, women's, and girls apparel indexes and the infants' and toddlers' apparel index also had three consecutive quarters of price increases. By contrast, the boys' apparel index and the footwear index decreased during the fourth quarter, after registering three consecutive quarterly increases in 2011. The jewelry and watches index rose in each quarter of the year.
The recreation index increased during the fourth quarter of 2011 at a seasonally adjusted annualized rate of 1.8 percent. Of note, however, is the continued decline in price movements of the televisions index, which decreased at a seasonally adjusted annualized rate of 13.0 percent. Annually, the televisions index decreased 17.1 percent from December 2010 to December 2011. The 5-year annualized decrease in the index from December 2006 to December 2011 was 20.4 percent.
Likewise, personal computers and peripheral equipment, a component of the communication index, continued decreasing during the fourth quarter of 2011, at a seasonally adjusted annualized rate of 9.9 percent. The index decreased by 12.5 percent from December 2010 to December 2011, whereas the 5-year annualized decrease from December 2006 to December 2011 was 11.1 percent.
The communication index had a quarterly decrease of 0.2 percent, in stark contrast to the education index, which increased 4.8 percent during the fourth quarter of 2011. In the aggregate, the education and communication index rose 2.2 percent during the last 3 months of 2011. Each quarterly price change was at a seasonally adjusted annualized rate.
Quarterly increases in the other goods and services index slowed to a seasonally adjusted annualized rate of 2.5 percent during the fourth quarter of 2011, following a quarterly rise of 2.9 percent during the third quarter.
Conclusion
In sum, 5 of the 8 major U.S. CPI-U index groups exhibited slower rates of growth, with the transportation index actually decreasing, during the fourth quarter of 2011, compared with the third quarter. The seasonally adjusted annualized quarterly decrease of 0.4 percent in the all items index was due largely to the significant quarterly decrease in the energy index; excluding energy, the all items less energy index increased at a seasonally adjusted annualized rate of 1.8 percent during the fourth quarter.
For more information, contact Darren Rippy at (202) 691-5377 or email: rippy.darren@bls.gov.
Notes
[1] The Chained CPI for All Urban Consumers (C-CPI-U), which BLS began publishing in August 2002, with data back to January 2000, also represents the urban population. The prices used in the C-CPI-U are the same as those used to produce the CPI-U, but the C-CPI-U uses a different formula and different weights to combine basic indexes.
[2] For more comparisons of the CPI-E, CPI-U, and CPI-W, see Kenneth J. Stewart, "The experimental consumer price index for elderly Americans (CPI-E): 1982–2007," Monthly Labor Review, April 2008, pp. 19–24, http://www.bls.gov/opub/mlr/2008/04/art2full.pdf.