
Focus on Prices and Spending | Consumer Expenditure | Volume 2, Number 16
Current Spending Topics: How do U.S. expenditures compare with those of other countries?
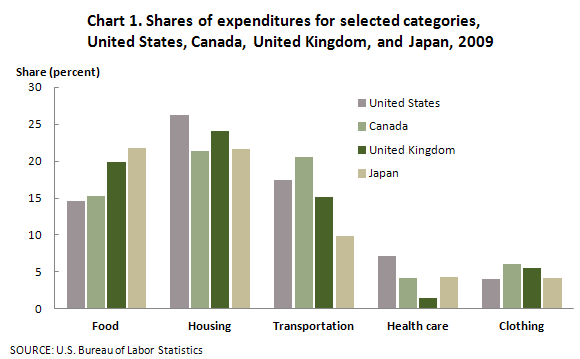
In Japan, consumers spent more than 17 percent of every yen on groceries, twice the 8.6 percent of every dollar that Americans spent. In the United States, households spent over 7 cents of every dollar on health care, compared with just 1.4 pence of every pound in the United Kingdom. This article compares how consumers in the United States, Canada, the United Kingdom, and Japan allocated different shares of total spending to categories such as food, housing, and transportation in 2009. Such variation can be expected, given differences in cultural tastes, the relative availability of goods and services, and institutional factors, such as government regulation and tax laws, among those countries. As shown in chart 1, housing and health care shares of total expenditures were higher in the United States than in Canada, the United Kingdom, and Japan in 2009, whereas Americans had the lowest clothing (or apparel) share. Canada had the highest clothing and transportation shares, and Japan had the highest food share, among the countries compared.
Comparisons of expenditure shares by category
Food. Table 1 shows that Japan's consumers spent 21.8 percent of their total expenditures on food in 2009. Of total spending on food in Japan, 21.4 percent was for food outside the home. The United Kingdom had the second-highest share: 19.9 percent of total expenditures on food. Canada, with 15.3 percent, and the United States, with 14.6 percent had the lowest food expenditure shares among the countries studied. Of the 14.6 percent of total expenditures allocated to food expenditures in the United States, 41.1 percent was spent outside the home. Although the United States had a higher percentage of expenditures for food away from home compared with Japan, the United States had a lower total food expenditure share.
Housing. The United States had the highest housing expenditure share, 26.3 percent of total expenditures in 2009. The United Kingdom and Japan followed, with 24.1 percent and 21.6 percent, respectively. Canada had the lowest housing share, 21.4 percent. Housing was the largest expenditure component in all countries except Japan. For purposes of comparability, the housing totals for the United States, the United Kingdom, and Canada were adjusted to exclude mortgage interest and mortgage principal payments because, although housing totals for Japan include rent, utilities, and communication, they do not include mortgage payments, on which no data are collected. Property taxes were excluded from the housing totals.
Transportation. Canada had the largest transportation share of all four countries, 20.6 percent. Canadians pay higher gas prices than Americans,[1] and the share of automobile expenditures was higher in Canada than in the United States (8.3 percent, compared with 6.1 percent). The United States and the United Kingdom had the next-highest transportation shares, 17.5 and 15.2 percent, respectively. Japan had the lowest, 9.8 percent. This smaller share is due to low expenditures for automobile purchases and other nonpublic transportation. Despite having the lowest total transportation share, Japan's share of spending on public transportation was twice that of the United States. Of Japan's 9.8-percent transportation share, 23.8 percent was for public transportation and 22 percent was for the purchase of automobiles. In comparison, of the 17.5-percent transportation share in the United States, 6.3 percent was for public transportation and 34.9 percent was for the purchase of automobiles.
Health care. The United States had the highest out-of-pocket health care share, 7.2 percent in 2009, followed by Japan, at 4.3 percent, Canada, with 4.2 percent, and the United Kingdom, at 1.4 percent. The health care share for the United States may be higher, because in Canada, the United Kingdom, and Japan medical costs are paid indirectly through nationalized health care options,[2] and medical costs paid indirectly are not included in out-of-pocket health care expenditures.
Clothing. Canada had the highest share of clothing expenditures in 2009 among the countries examined, with 6 percent of its total expenditures spent on clothing. The United Kingdom had the second-highest clothing share, 5.5 percent, Japan had a clothing share of 4.2 percent, and the United States had the smallest share, 4 percent.
| Category | United States | Canada | United Kingdom | Japan |
|---|---|---|---|---|
Food |
14.6 | 15.3 | 19.9 | 21.8 |
Food at home |
8.6 | 11.6 | 13.6 | 17.2 |
Food away from home |
6.0 | 3.7 | 6.3 | 4.6 |
Housing |
26.3 | 21.4 | 24.1 | 21.6 |
Transportation |
17.5 | 20.6 | 15.2 | 9.8 |
Automobiles |
6.1 | 8.3 | 5.1 | 2.2 |
Public transportation |
1.1 | 2.0 | 2.5 | 2.3 |
All other transportation |
10.3 | 10.2 | 7.6 | 5.3 |
Health care |
7.2 | 4.2 | 1.4 | 4.3 |
Clothing |
4.0 | 6.0 | 5.5 | 4.2 |
Education |
2.4 | 2.6 | 1.8 | 4.0 |
Culture/Entertainment/Recreation |
6.5 | 8.6 | 15.1 | 11.2 |
Alcoholic beverages and tobacco products |
1.9 | 3.2 | 4.8 | 1.6 |
Other categories(1) |
19.6 | 18.1 | 12.2 | 21.6 |
|
(1) Including miscellaneous expenditure shares and categories that are unique to a particular country. Because these categories were different for each country, they were not used in direct comparisons in this article. |
||||
Survey data
U.S. data used in this article are from the Consumer Expenditure Survey, which collects information from the nation's households and families on their buying habits (expenditures), income, and household characteristics. The data are collected by the U.S. Census Bureau for the Bureau of Labor Statistics. The sampling unit is the consumer unit.[3] The survey consists of two components—a quarterly Interview Survey and a weekly Diary Survey—each with its own questionnaire and sample. In the Interview Survey, each consumer unit is interviewed every 3 months, for a total of five interviews. In the Diary Survey, respondents are asked to keep track of all their purchases made each day for two consecutive 1-week periods. Participants receive each weekly diary during a separate visit by a Census Bureau interviewer. The Interview Survey yields approximately 28,000 usable interviews annually, the Diary Survey, about 14,000.
Expenditure data for Canada are derived from the Survey of Household Spending (SHS),[4] the main purpose of which is to obtain detailed information about household spending during the previous calendar year. The survey is conducted from January to March in the year following the reference year and covers about 98 percent of the Canadian population in the 10 provinces and 92 percent of the population of the three territories. The sample for the SHS is a stratified multistage sample selected from the Labour Force Survey sample frame, with a sample size of approximately 17,000 households. The sample unit is the household.
The United Kingdom's expenditure data are derived from the Living Costs and Food Survey,[5] which collects primarily information on household expenditures of goods and services while also collecting information on incomes of the household members. The survey is a continuous one, with interviews spread evenly over the year to account for seasonality. The sampling unit is the household, and approximately 11,500 addresses were selected in 2009, resulting in roughly 5,200 households responding. The data collected are published as average weekly expenditures. For purposes of this article, the weekly expenditure averages are multiplied by 52 to obtain annual averages.
Japan's expenditure data are derived from the National Survey of Family Income and Expenditure (NSFIE),[6] a sample survey conducted for the Japan Statistics Bureau every 5 years, with the latest survey having been conducted in 2009. The survey collects information on household income and expenditures, savings and liabilities, consumer durables, and residences and residential property. The sample unit is the household, and approximately 55,000 households were surveyed in 2009. The interviewing period covered September 2009 to November 2009 for households with two or more people and October 2009 to November 2009 for households with one person.
Methodology
Expenditure shares are the percentages of total expenditures allotted to each expenditure category. These shares usually do not fluctuate much in the short term and are more useful for identifying spending trends than examining percent changes in expenditures from one year to the next. In order to make the shares data of the three foreign countries examined compatible with U.S. shares data for this article, several adjustments were made to expenditure categories.
To derive the housing share data for Canada, expenditures on shelter, household operation, and household furnishings and equipment are combined into one housing category. As in the United States, health care expenditures in Canada are out-of-pocket expenditures for medical supplies and services, prescription drugs, and premiums for health insurance. Transportation expenditures are also similar in both countries, covering both public and private transportation, gasoline, and expenditures on vehicles. One difference between the two countries is that Canada's Survey of Household Spending includes personal income taxes and mortgage principal in its expenditure computations, whereas the U.S. CE survey does not. For purposes of this article, mortgage interest and mortgage principal expenditures are excluded from the Canadian housing totals and personal income taxes are excluded from total expenditures.
In the United Kingdom, the hotels portion of the restaurant and hotels category is combined with the housing, fuel, and power category. Additional adjustments in that country include moving the restaurant portion of expenditures on restaurants and hotels to food and nonalcoholic beverages and shifting alcoholic beverages bought at restaurants into the alcoholic beverages and tobacco products category. Mortgage interest and mortgage principal expenditures are excluded from the housing calculations.
In Japan, transportation expenditures are combined with communication expenditures, and to provide a transportation expenditure category comparable with that in the United States, communication expenditures are moved into the housing category. For Japan, charges for fuel, light, and water; furniture and utensils; and communications are added to housing to form a combined housing category. Expenditures for alcoholic beverages and tobacco products are separate categories in both the United States and Japan, but for comparison purposes with Canada and the United Kingdom, which combine the two categories, these expenditures are combined in this article.
Summary
This article compares the adjusted U.S. Consumer Expenditure Survey expenditure shares with expenditure shares from Canada, the United Kingdom, and Japan. The people of these four industrialized nations spend their budgets differently. The United States had the highest shares of housing and health care expenditures in 2009, compared with the other three countries. Japan's share of food expenditures was the highest among the four countries and was even larger than Japan's share of housing. Canada had the highest clothing and transportation expenditure shares and shares of out-of-pocket health care expenditures were the lowest in the United Kingdom. Data tables, CE publications, a glossary, survey forms, and other information are available at www.bls.gov/cex, email: cexinfo@bls.gov. . If you have any questions, contact Brett Creech with the Consumer Expenditure Survey program, at Creech.Brett@bls.gov or (202) 691-5120.
Notes
[1] For a comparison of Canadian vs. U.S. gas prices, see "Historical Price Charts" (Brooklyn Park, MN: GasBuddy.com, 2012), http://www.gasbuddy.com/gb_retail_price_chart.aspx?city1=USA Average&city2=Canada Average&city3=&crude=nutmeg=36&units=us.
[2] For a comparison of the U.S., Canadian, U.K., and Japanese health care systems, see "Market Watch: How the world compares on health care," The Wall Street Journal, March 5, 2012, http://www.marketwatch.com/health-care/reform/snapshot. Canada and the United Kingdom have a single-payer health care system in which health care costs are paid through taxes. Japan offers a national health insurance program as well as private insurance. In both cases, citizens pay premiums and costs are subsidized by the government.
[3] A consumer unit consists of any of the following: (1) All members of a particular household who are related by blood, marriage, adoption, or some other legal arrangement; (2) a person living alone or sharing a household with others or living as a roomer in a private home or lodging house or in permanent living quarters in a hotel or motel, but who is financially independent; (3) two or more persons living together who use their incomes to make joint expenditure decisions. Financial independence is determined by spending behavior with regard to the three major expense categories: housing, food, and other living expenses. To be considered financially independent, the respondent must provide at least two of the three major expenditure categories, either entirely or in part. The terms consumer unit, family, and household are often used interchangeably for convenience. However, the proper technical term for purposes of the Consumer Expenditure Survey is consumer unit.
[4] For a detailed description of Canada's Survey of Household Spending, see "Survey of Household Spending" (Ottawa, ON: Statistics Canada, December 17, 2010), http://www.statcan.gc.ca/imdb-bmdi/3508-eng.htm.
[5] For information regarding the United Kingdom's Living Costs and Food Survey, see Family Spending, 2010 Edition (London: Office of National Statistics, November 30, 2010) http://www.ons.gov.uk/ons/rel/family-spending/family-spending/2010-edition/index.html.
[6] For information on Japan's National Survey of Family Income and Expenditure, see "National Survey of Family Income and Expenditure" (Tokyo: Statistics Bureau, 2009), http://www.stat.go.jp/english/data/zensho/index.htm.