October 4, 2012 (The Editor’s Desk is updated each business day.)
Payroll employment in metropolitan areas, August 2011–August 2012
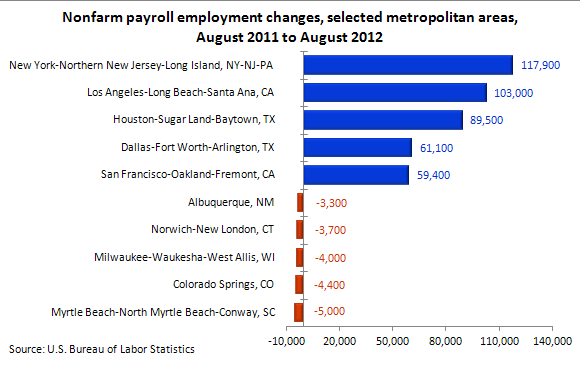
Nonfarm payroll employment increased in 274 metropolitan areas from August 2011 to August 2012, not seasonally adjusted; employment decreased in 92 areas over the year and showed no change in 6 areas. The largest over-the-year employment increase occurred in New York-Northern New Jersey-Long Island, New York-New Jersey-Pennsylvania (+117,900), followed by Los Angeles-Long Beach-Santa Ana, California (+103,000), and Houston-Sugar Land-Baytown, Texas (+89,500).
[Chart data]
The largest over-the-year decrease in employment occurred in Myrtle Beach-North Myrtle Beach-Conway, South Carolina (−5,000), followed by Colorado Springs, Colorado (−4,400), and Milwaukee-Waukesha-West Allis, Wisconsin (−4,000).
In percentage terms, the largest over-the-year increase in employment occurred in Lafayette, Louisiana (+9.4 percent), followed by Columbus, Indiana (+9.1 percent), and Pascagoula, Mississippi (+6.9 percent). The largest over-the-year percentage decrease in employment was reported in Dalton, Georgia (−5.1 percent), followed by Hot Springs, Arkansas (−4.9 percent), Yuba City, California (–4.3 percent), and Pittsfield, Massachusetts (−4.2 percent).
These data are from the Current Employment Statistics (State and Metro Area) program. Data for the most recent month (August 2012) are preliminary and subject to revision. The data are not seasonally adjusted. To learn more, see "Metropolitan Area Employment and Unemployment – August 2012" (HTML) (PDF), news release USDL-12-1980.
Related TED articles
Employment |
Metropolitan areas and counties
Of interest
Spotlight on Statistics: National Hispanic Heritage Month
In this Spotlight, we take a look at the Hispanic labor force—including labor force participation, employment and unemployment, educational attainment, geographic location, country of birth, earnings, consumer expenditures, time use, workplace injuries, and employment projections.
Read more »