Human Salmonella Infections Linked to Small Turtles
Posted September 20, 2012 3:30 PM ET
Epi Curve
This outbreak can be visually described with a chart showing the number of persons who became ill each day. This chart is called an epi curve. Please see the Timeline for Reporting of Salmonella Cases for more details on the reporting process.
Current Epi Curve
Persons infected with the outbreak strains of Salmonella, by date of illness onset*
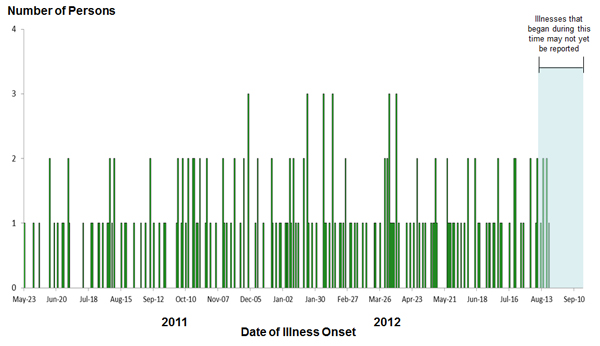
*n=196 for whom information was reported as of September 10, 2012. Some illness onset dates have been estimated from other reported information. Illnesses that occurred after August 4, 2012 may not yet be reported due to the time it takes between when a person becomes ill and when the illness is reported. This takes an average of 2 to 3 weeks.
« Read the full Outbreak Investigation
Previous Epi Curves
Epi Curve: August 8, 2012
Persons infected with the outbreak strains of Salmonella, by date of illness onset*
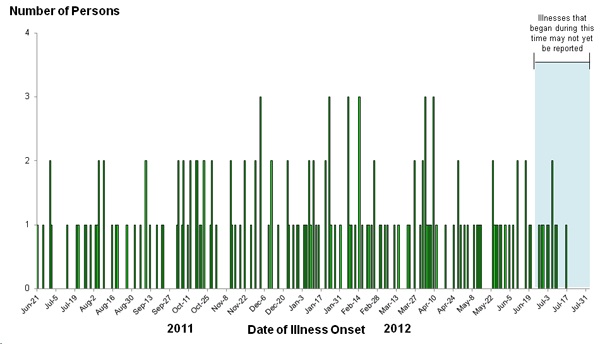
*n=168 for whom illness onset date was reported as of August 2, 2012. Some illness onset dates have been estimated from other reported information. Illnesses that occurred after June 25, 2012 may not yet be reported due to the time it takes between when a person becomes ill and when the illness is reported. This takes an average of 2 to 3 weeks.
Epi Curve: June 25, 2012
Persons infected with the outbreak strains of Salmonella, by date of illness onset*
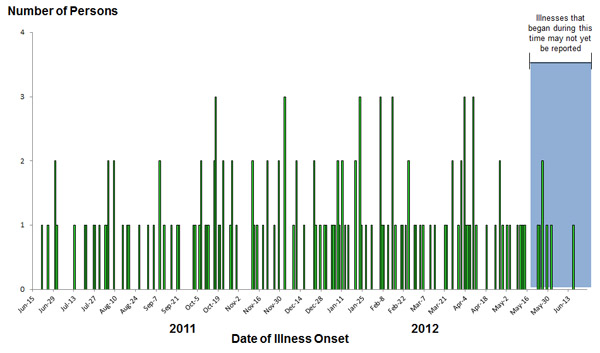
*n=149 for whom illness onset date was reported as of June 25, 2012. Some illness onset dates have been estimated from other reported information. Illnesses that occurred after May 17, 2012 may not yet be reported due to the time it takes between when a person becomes ill and when the illness is reported. This takes an average of 2 to 3 weeks.
Epi Curve: May 8, 2012
Persons infected with the outbreak strains of Salmonella, by date of illness onset*
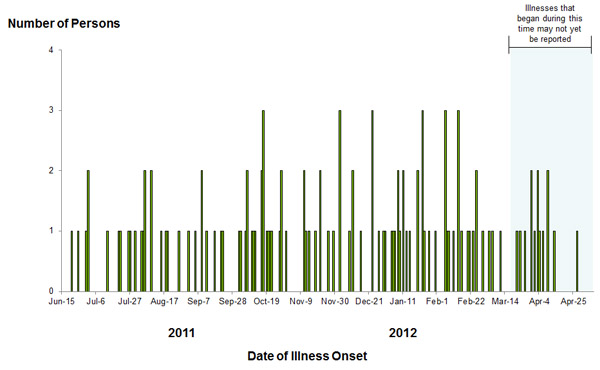
*n=124 for whom information was reported as of May 8, 2012. Illnesses that occurred after March 18, 2012 might not yet be reported due to the time it takes between when a person becomes ill and when the illness is reported. This takes an average of 2 to 3 weeks.
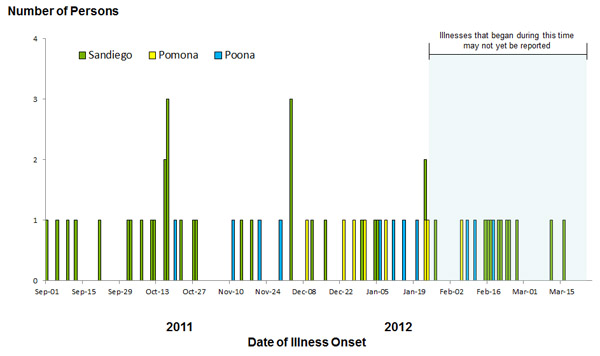
Epi Curve: April 4, 2012
Persons infected with the outbreak strain of Salmonella, by date of illness onset*
Onset data not currently available for all persons with reported illness.
*n=71 for whom information was reported as of April 4, 2012. Illnesses that occurred after February 9, 2012 might not yet be reported due to the time it takes between when a person becomes ill and when the illness is reported. This takes an average of 2 to 3 weeks.
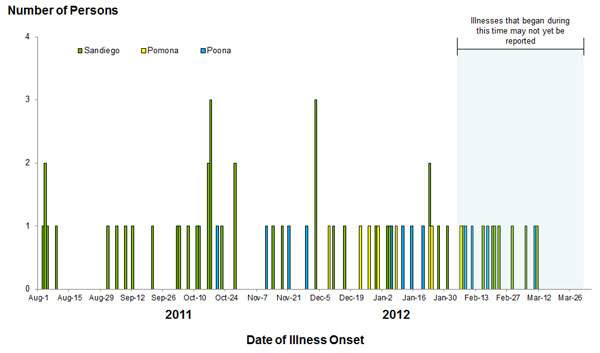
Epi Curve: March 26, 2012
Persons infected with the outbreak strain of Salmonella, by date of illness onset*
Onset data not currently available for all persons with reported illness.
*n=65 for whom information was reported as of March 26, 2012. Illnesses that occurred after January 26, 2012 might not yet be reported due to the time it takes between when a person becomes ill and when the illness is reported. This takes an average of 2 to 3 weeks.
Get email updates
To receive email updates about this page, enter your email address:
Contact Us:
- Centers for Disease Control and Prevention
1600 Clifton Rd
Atlanta, GA 30333 - 800-CDC-INFO
(800-232-4636)
TTY: (888) 232-6348 - New Hours of Operation
8am-8pm ET/Monday-Friday
Closed Holidays - cdcinfo@cdc.gov
