| Geography |
 Back to Top Back to Top |
-
State covered: New York
Reliability region: New York ISO (NYISO) sub-region of the Northeast Power Coordinating Council (NPCC) [NERC regions map
Balancing authority: New York ISO (NYISO)
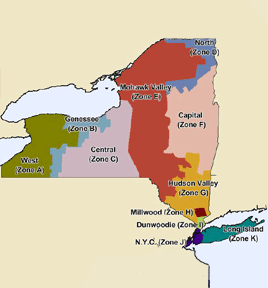
Load Zones: Capital (Zone F), Central (Zone C), Dunwoodie (Zone I), Genesee (Zone B), Hudson Valley (Zone G), Long Island (Zone K), Millwood (Zone H), Mohawk Valley (Zone E), New York City (Zone J), North (Zone D), West (Zone A)
| RTO/ISO |
 Back to Top Back to Top |
-
New York ISO (NYISO) (established 1999) operates the region’s power grid and wholesale electric markets:
- Energy market: two-settlement (day ahead and real-time) spot market with locational marginal pricing,
- Regional and locational capacity market, and
- Financial transmission rights market.
New York ISO 2009 State of the Markets Report
Market Monitor:
David Patton – Market Monitoring Unit, Potomac Economics, LTD.
Also, market participants trade electricity bilaterally through brokers, the IntercontinentalExchange (ICE) and the New York Mercantile Exchange’s (Nymex) ClearPort, using NYISO zones as pricing points. However, bilateral deals that go physical must be scheduled with the ISO.
| Generation/Supply |
 Back to Top Back to Top |
-
Marginal fuel type: natural gas
Generating capacity (summer 2006): 39,704 MW
Capacity reserve (summer 2006): 5,765 MW
Reserve margin (summer 2006): 17%
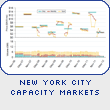
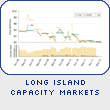
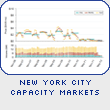
The New York City metropolitan area (NYC) and Long Island (LI) are areas of concentrated demand. Both localities have requirements for installed generating capacity that are more stringent than the rest of the region, to ensure reliability of service.
| Demand |
 Back to Top Back to Top |
-
All time peak demand: 33,035 MW (set August 2, 2006)
In summer of 2006, demand reached record levels on several occasions due to extremely hot weather.
Peak demand growth: 5.6 % (2006-2005)
| 2005 | 2006 | 2007 | 2008 | 2009 | |
|---|---|---|---|---|---|
| Summer Peak Demand (MW) | 31,011 | 33,035 | 31,284 | 31,540 | 29,781 |
| Source: Derived from ISO-NE Data | |||||
Load pockets: Zone J New York City and Zone K Long Island
| Prices |
 Back to Top Back to Top |
-
Annual Average Day-Ahead Price
Zone J New York City
2006: $71.28/MWh
2007: $77.21/MWh
2008: $96.25/MWh
2009: $47.08/MWh
Zone K Long Island
2006: $86.11/MWh
2007: $86.86/MWh
2008: $99.77/MWh
2009: $50.38/MWh
Contact Information:
For questions regarding the material in the New York section please contact our staff at: oversight@ferc.gov


