October 2, 2012 (The Editor’s Desk is updated each business day.)
Occupational employment and wages in green goods and services
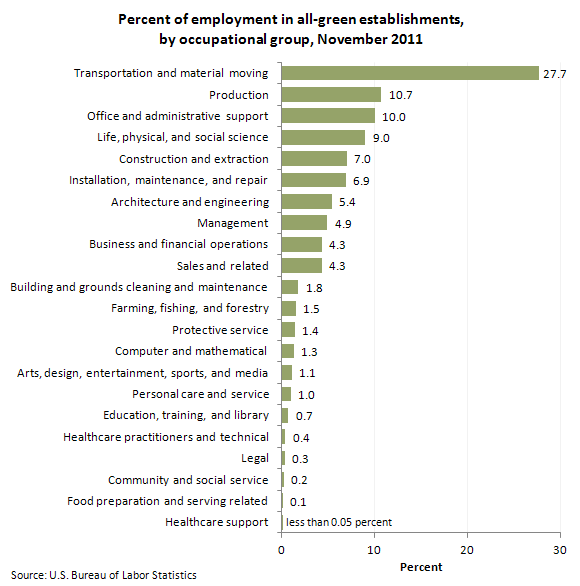
In November 2011, transportation and material moving occupations accounted for 539,470 jobs, or approximately 28 percent of total employment, in all-green establishments—those that received all of their revenue from green goods and services (GGS).
[Chart data]
The production (208,180) and office and administrative support (194,440) occupational groups were the second- and third-largest in all-green establishments, representing about 11 and 10 percent of employment, respectively.
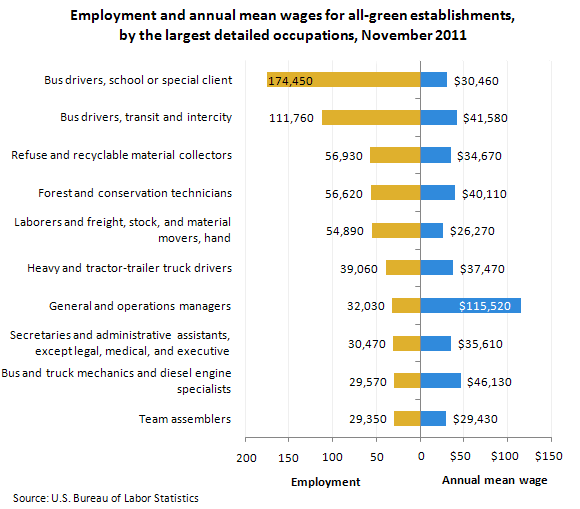
Five of the largest detailed occupations in all-green establishments were in the transportation and material moving occupational group: school or special client bus drivers (174,450); transit and intercity bus drivers (111,760); refuse and recyclable materials collectors (56,930); hand laborers and freight, stock, and material movers (54,890); and heavy and tractor-trailer truck drivers (39,060).
[Chart data]
The largest occupations in all-green establishments outside of the transportation and material moving group included forest and conservation technicians, with employment of 56,620; general and operations managers (32,030); secretaries and administrative assistants, except legal, medical, and executive (30,470); and bus and truck mechanics and diesel engine specialists (29,570).
Annual mean wages for the largest occupations in all-green establishments ranged from $26,270 for hand laborers and freight, stock, and material movers to $115,520 for general and operations managers.
The GGS occupational employment and wages data are compiled through the GGS survey under the Green Goods and Services Occupations program. According to 2010 annual average data published by the GGS survey, about three-fifths of the 3.1 million jobs associated with green goods and services production were in establishments that received all of their revenue from green goods and services. This release presents November 2011 occupational employment and wage information for 1.9 million jobs in these all-green establishments. To learn more, see "Occupational Employment and Wages in Green Goods and Services — November 2011" (HTML) (PDF), news release USDL-12-1941.
Related TED articles
Earnings and wages |
Employment |
Occupations
Of interest
Spotlight on Statistics: National Hispanic Heritage Month
In this Spotlight, we take a look at the Hispanic labor force—including labor force participation, employment and unemployment, educational attainment, geographic location, country of birth, earnings, consumer expenditures, time use, workplace injuries, and employment projections.
Read more »