Home > NCEP Quarterly Newsletter > January 2012
January 2012
Sample of Global RTOFS output fields.
Click image to zoomClick image to zoom
A global Real-Time Ocean Forecast System (RTOFS) was implemented in operations at NOAA/NWS/NCEP on October 25, 2011. This system is based on an eddy-resolving 1/12 degree global HYCOM (HYbrid Coordinates Ocean Model) and is part of a larger national backbone capability of ocean modeling at NWS in strong partnership with the US Navy.
Sample of Global RTOFS output fields.

The forecast system is run once a day and produces a 6-day forecast using the daily initialization fields produced at the Naval Oceanographic Office (NAVOCEANO) using NCODA (Navy Coupled Ocean Data Assimilation), a 3D multi-variate data assimilation methodology. As configured within RTOFS, HYCOM has a horizontal equatorial resolution of 0.08° or ~9 km. The HYCOM grid is on a Mercator projection from 78.64°S to 47°N and north of this it employs an Arctic dipole patch where the poles are shifted over land to avoid a singularity at the North Pole. This gives a mid-latitude (polar) horizontal resolution of approximately 7 km (3.5 km). The coastline is fixed at 10 m isobath with open Bering Straits. This version employs 32 hybrid vertical coordinate surfaces with potential density referenced to 2000 m. Vertical coordinates can be isopycnals, often best for resolving deep water masses, levels of equal pressure (fixed depths), best for the well mixed unstratified upper ocean and sigma-levels (terrain-following), often the best choice in shallow water. The dynamic ocean model is coupled to a thermodynamic energy loan ice model and uses a non-slab mixed layer formulation. The forecast system is forced with 3-hourly momentum, radiation and precipitation fluxes from the operational Global Forecast System (GFS) fields. Output includes global sea surface height and three dimensional fields of temperature, salinity, density and velocity fields in NetCDF format.

The global surface currents and temperature fields from the Global-RTOFS are used by the U.S. Coast Guard (USCG) for planning for their Search and Rescue Operations, and by the NOAA Office of Response and Restoration (ORR) for response to hazardous materials spill emergencies in the maritime environment. Prior to the model becoming operational, the Ocean Prediction Center (OPC) began to deliver near real-time model data to USCG and ORR in late summer 2011 to enable both organizations to prepare for the arrival of the new model data. OPC also built parallel data delivery of the Global RTOFS data, along with the Navy operational global model, known as global NCOM, to users that rely on those near-real-time data. OPC is working with NCOM data users to update their applications to adopt the real time Global RTOFS model data, as the Navy is expected to discontinue the global NCOM in favor of the Global HYCOM as their operational global ocean model.
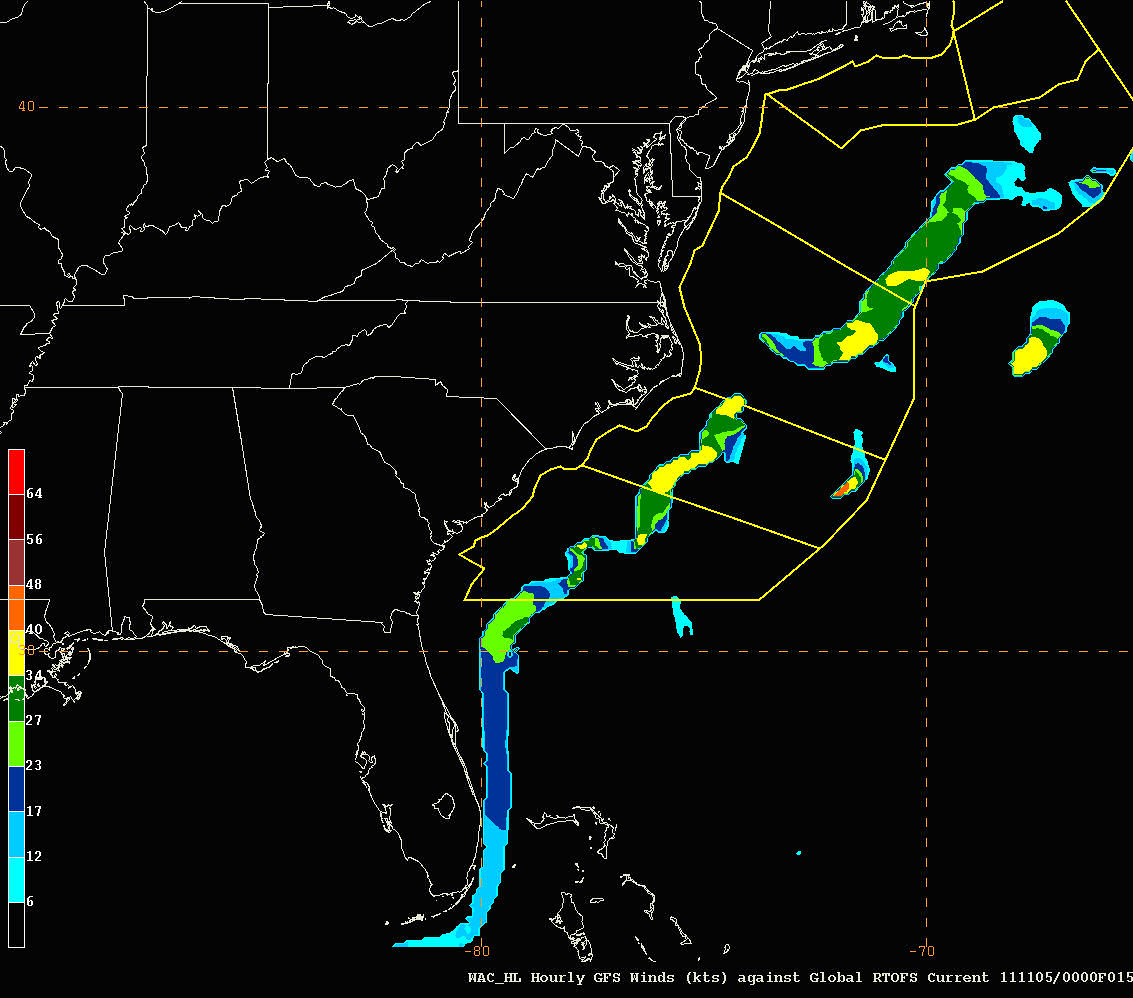
Areas of hazardous surface wave conditions in the Gulf Stream off the North Atlantic coast.

Real time ocean model guidance for surface ocean currents enables OPC to provide enhanced navigation safety information. For example, in areas where strong ocean surface currents flow against strong surface winds, the condition creates strong surface wave conditions that could be hazardous to ships. The unusually strong wave conditions under this circumstance are not accounted for by the present operational wave forecast model. The figure above illustrates the Gulf Stream area in the North Atlantic where such hazardous conditions often are found. The new global RTOFS provides improved simulation of the Gulf Stream conditions, better resolves fine structures of ocean surface currents, and provides OPC a more powerful tool to identify the wind-against-current hazards, thus enabling OPC to better serve mariners. navigation safety needs when traveling in the Gulf Stream area.


Animation of high-resolution 3km HWRF simulation of Hurricane Irene.  Cloud condensation fields are shown in gray, superimposed on 10m wind field shown in color.
Click image to zoomClick image to zoom
Since its initial implementation in 2007, the atmosphere-ocean coupled NCEP/Environmental Modeling Center (EMC) operational Hurricane Weather Research and Forecast (HWRF) modeling system has been providing numerical guidance on tropical cyclone tracks and intensity to the hurricane forecasters at the National Hurricane Center (NHC) for Atlantic and Eastern Pacific basins.

Since its initial implementation in 2007, the atmosphere-ocean coupled NCEP/Environmental Modeling Center (EMC) operational Hurricane Weather Research and Forecast (HWRF) modeling system has been providing numerical guidance on tropical cyclone tracks and intensity to the hurricane forecasters at the National Hurricane Center (NHC) for Atlantic and Eastern Pacific basins.

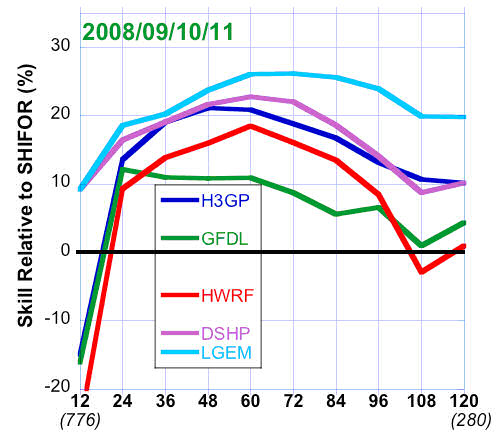
As a major step towards improving the intensity forecast skill and addressing rapid intensity changes, the HWRF modeling system is being upgraded with triple-nest capability that includes a cloud-resolving inner-most grid operating at 3 km horizontal resolution (Fig.1) and an improved GFS boundary layer parameterization scheme that provides planetary boundary layer (PBL) structure consistent with observations. This is a collaborative effort between the HWRF team at NCEP/EMC and the hurricane modeling team at the Atlantic Oceanographic and Meteorological Laboratory/Hurricane Research Division under the auspices of NOAA's Hurricane Forecast Improvement Project (HFIP). This model was tested in real-time for the 2011 hurricane season through participation in the HFIP Stream 1.5 forecast demonstration project. Retrospective and real-time experiments from this high-resolution triple-nested system for four hurricane seasons (2008-11) showed about 10-15% improvement in the intensity forecast skill compared to the operational HWRF and GFDL hurricane models (Fig. 2).

It should be noted that this leap-step advancement of the HWRF system is coming at a time where there is no planned increase in computational resources for the operations for the next several years. The HWRF team at EMC has been very creative in optimizing codes and getting the most out of the computing as possible, and ensured a secured pathway to a major implementation plan for the 2012 hurricane season with very little additional resources . this is a significant feat associated with science and engineering. Further advancements planned for the 2012 implementation include implementation of a new centroid-based vortex tracking algorithm, re-design of the operational HWRF vortex initialization procedure with improved interpolation algorithms, implementation of new GFS PBL and Shallow Convection parameterization schemes, modifications to Ferrier Microphysics scheme and a high-resolution tracker. Additional products from operational HWRF will include synthetic satellite imagery from GOES, simulated SSMI/S (Special Sensor Microwave Imager / Sounder microwave reflectivity products, and very high temporal resolution (every time-step) information on tropical storm location and intensity. These products will allow NHC forecasters to look at the detailed structure of predicted storms and potentially use that information to estimate potential for rapid intensity changes.

Future developmental activities for the HWRF system include the capability of multiple movable grids, coupling to NCEP.s global HyCOM ocean model and Noah land surface model, improvements to the vortex initialization procedure, assimilation of aircraft data and cloudy radiance data for the inner core, ensembles, regional hybrid data assimilation, improvements to the physics at high resolution, and a core diagnostics effort designed to identify areas for improvement.

Animation of high-resolution 3km HWRF simulation of Hurricane Irene.  Cloud condensation fields are shown in gray, superimposed on 10m wind field shown in color.
Animation of high-resolution 3km HWRF simulation of Hurricane Irene. Cloud condensation fields are shown in gray, superimposed on 10m wind field shown in color.
When viewed from different angles at 96 hr forecast time.
Intensity forecast skill from 3km triple nested HWRF (H3GP) compared against the operational hurricane models HWRF and GFDL, and statistical models Decay SHIPS (Statistical Hurricane Intensity Prediction Scheme) (DSHP) and LGEM (Logistic Growth Equation Model).  Results shown here correspond to several storms from four Atlantic hurricane seasons (2008-11).
Intensity forecast skill from 3km triple nested HWRF (H3GP) compared against the operational hurricane models HWRF and GFDL, and statistical models Decay SHIPS (Statistical Hurricane Intensity Prediction Scheme) (DSHP) and LGEM (Logistic Growth Equation Model). Results shown here correspond to several storms from four Atlantic hurricane seasons (2008-11).

Full NAM computational domain with locations of the CONUS, Alaska, Hawaii, Puerto Rico nested domains and examples (in yellow) of the moveable fire weather nest domain.
Click image to zoomClick image to zoom
A major upgrade to the North American Mesoscale (NAM) forecast system was implemented into NCEP operations on Tuesday, October 18, 2011.
The new NAM system represents the most comprehensive upgrade ever performed in the system's 18 year history, as every component (infrastructure, analysis, forecast model, and product generation) underwent extensive changes or replacement, raising NAM forecast guidance to state-of-the-art levels.

A major component of this implementation is the introduction of the new NOAA Environmental Modeling Framework (NEMS), which is based on the tenets put forth by the Earth Modeling System Framework to which NOAA has subscribed. Eventually all of NCEP's numerical models will be placed within the NEMS framework. This NAM upgrade represents the first implementation of NEMS and is a major step in the evolution of NCEP's modeling suite. The NAM prediction model has evolved from a strictly regional Nonhydrosatic Mesoscale Model (NMM) to a new extended capability version now known as the Nonhydrostatic Multiscale Model on B-grid (NMMB), which can be efficiently run regionally or globally with or without embedded nests.

Full NAM computational domain with locations of the CONUS, Alaska, Hawaii, Puerto Rico nested domains and examples (in yellow) of the moveable fire weather nest domain.

Another major enhancement is the addition of 5 high-resolution nested domains inside of the parent NAM. Four of these domains, placed over the CONUS, Alaska, Hawaii, and Puerto Rico as shown in the figure of the domain, will produce forecast guidance at 2-4 times the horizontal resolution of the parent 12 km NAM domain out to 2.5 days, thus making downscaling of the coarser NAM output unnecessary and providing forecasters high-resolution guidance they can use directly. Also, a moveable very high-resolution (1.3-1.5 km grid spacing) nest is run out to 1.5 days. This nest, designed primarily to support Fire Weather forecasting, can be placed anywhere within the CONUS or Alaska nests. Outside of the fire weather season, this nest is run for significant weather events as determined by the NCEP Senior Duty Meteorologist in coordination with the NCEP Centers. An example of this flexible capability is shown in the plot of the 1.3 km forecast of Hurricane Irene just east of the Delmarva Peninsula. (To view an animation of this complete forecast for Irene, click here)

Fire weather nest forecast of sea level pressure and 1-h accumulated precipitation valid 0600 UTC 28 August 2011.

Supercomputer data center.
Click image to zoomClick image to zoom
IBM was awarded the $502M (inclusive of options) federal contract for the next operational weather and climate supercomputer on Nov. 23, 2011.
The new agreement continues the 10-year relationship between IBM and NOAA until 2016 and optionally through 2021. The Information Technology investment includes operational supercomputing systems and facilities and a lifecycle technology refreshment every three (3) years, resulting in computing capacity increases. In addition to high-performance computing technology, IBM will provide managed services including a primary and a back-up data center, application support, systems administration and program management. The new system will significantly bolster NOAA's ability to provide weather, climate, ocean and space weather information with increased accuracy and shorter lead times.
Supercomputer data center.

NCEP Logo
Click image to zoomClick image to zoom
In November, NCEP Central Operations (NCO) completed a network expansion for NOAA and the Committee for Operational Processing Centers (COPC).
COPC coordinates data assimilation, analysis, and environmental prediction efforts through NOAA and the Department of Defense (DoD). COPC is comprised of senior leadership from NCEP, National Environmental Satellite, Data, and Information Service (NESDIS), Air Force Weather Agency (AFWA), Naval Oceanographic Office (NAVO), and Fleet Numerical Meteorology and Oceanography Center (FNMOC). In October, the network was leveraged to support National Polar-orbiting Operational Environmental Satellite System (NPOESS) Preparatory Project (NPP) testing. Without installation of this network, NPP testing could not proceed.

This upgrade provides a faster more reliable network connection between NCEP, DoD, NESDIS and the National Weather Service (NWS) Telecommunication Operations Center (TOC). The network will expand to support additional satellite data associated with the new NESDIS polar and geostationary satellites, new model product exchanges from the National Unified Operational Prediction Capability, and DoD access to NCEP's operational data sources including NOMADS (NOAA Operational Model Archive and Distribution System).

This network expansion transforms NCEP's approach to building, maintaining, and scaling its networks and is a significant accomplishment for this reason.

When NESDIS upgrades its internal Local Area Network (LAN), NCEP will have a tenfold increase in network capacity for access to NESDIS polar and geostationary satellites data. The DoD plans to implement its connection by February 2013.


Figure 1 . Seat installation in auditorium
Click image to zoomClick image to zoom
Work continues on the NCWCP, a four story, 268,762 sq ft building designed to house approximately 800 employees of five centers of the National Centers for Environmental Prediction, two groups from the National Environmental Satellite, Data, and Information Service and NOAA's Air Resources Laboratory, located in Riverdale, MD.
Skanska, the construction company selected to complete the NCWCP, continues to make considerable progress. The schedule has occupants beginning to move at the beginning of August, 2012. Dual operations for NCEP and NESDIS's operational sections will commence in mid-August, 2012 with move-in complete for all groups by the end of September, 2012. Meanwhile, progress can be seen in the auditorium where the seats have been installed (see Figure 1), conference rooms (see Figure 2), and the terrazzo floor in the atrium (see Figure 3).

Figure 1 . Seat installation in auditorium
Figure 2 . Conference rooms on second floor
Figure 3 . Terrazzo floor in atrium

NOAA Center for Atmospheric Sciences at Howard University summer 2011 interns, from left to right: Jessica Narkiewicz (Stony Brook University), John Moore (Jackson State University), Karimar Ledesma Maldonado (University of Puerto Rico at Mayaguez), Emma Foley (Gustavus Adolphus College), Adam Schwantes (Northland College), Joe Puma (Glenbard West HS), Siddarth Plakkot (University of Maryland at College Park), and Stephanie Chavez (University of Texas at El Paso).
Click image to zoomClick image to zoom
Being an intern in the Washington, DC region is a big deal in most circles around the city. Interns have been flocking to Washington for many years to experience life within the political bubble called Washington, DC.

Recently, at the National Centers for Environmental Prediction (NCEP), interns have become an accepted part of the culture and outreach mechanism for centers such as the Environmental Modeling Center (EMC), NCEP Central Operations (NCO), and the Hydrometeorological Prediction Center (HPC). For a long time, NCEP didn't have very many interns walk through the halls of the World Weather Building, but with the establishment of the NOAA Center for Atmospheric Science (NCAS) at Howard University there has been a surge of interaction between NCEP and the university.

The students that the program attracts come from all over the United States. In 2011, college students such as Emma Foley (Gustavas Adolphus College), Adam Schwantes (Northland College), and Karimar Ledesma Maldonado (University of Puerto Rico Mayaguez) all found their way to NCEP's offices in Camp Springs, MD.

NCAS opened the doors to high school students this year and several students took full advantage of the great opportunity. Siddarth Plakkot (Huntingtown HS, MD), Joe Puma (Glenbard West HS, IL), and William Davis (DeMatha HS, MD) were all from high schools. In particular Joe Puma (HPC intern) who is what some call a "weather weenie", found that "the best part of working at NCEP, especially HPC, was being surrounded by forecasters and scientists who share that same level of passion for meteorology and weather. It was nice having someone who understood my passion." His passion was shared by many this summer and fostered to a level where Joe is taking this experience and joining the local WFO in Chicago as a student volunteer. The Chicago area WFO has never accepted a high school student for this position but because of his experience at HPC, they made an exception.

"The best part of working for NCEP was being in the work environment, being able to see and interact with all the scientists and specialists, and learning about how truly extensive and complex the operations are at NCEP", says Siddarth Plakkot (EMC intern) who completed a project on the South Asian Monsoon and plans to present his work at the American Meteorological Society Conference in New Orleans, LA.

Siddarth also felt that "through this internship, I believe I picked up valuable programming and research experience that can be used for college and in the future. My experience at NCEP taught me the complexities and constraints of research, but I definitely feel confident leading a research based project in future."

Another unique opportunity that the meteorology students enjoyed was the daily HPC weather briefings which were Adam Schwantes's (NCO intern) favorite part of the internship. "I learned a lot about how the National Weather Service produces forecasts." Adam also received a significant level of experience in Numerical Weather Prediction (NWP) and computer programming which he hopes will lead to a position within a Weather Forecast Office (WFO). Adam is also working on the Indian Monsoon project as a lead investigator and he hopes this will lead to his first peer-reviewed publication.

In 2001, NCAS was awarded a cooperative agreement with the Department of Commerce National Oceanic and Atmospheric Administration -Educational Partnership Program. "NCAS has sponsored a summer internship program that provides research experiences to undergraduates (and more recently, high school students) to work with NCAS and NCEP scientists during eight to twelve weeks each summer. This is part of our pipeline program to recruit, train, and retain young scientists in NOAA-relevant fields of study. The students are provided room, board, stipends, and even travel awards to present their work at the National Weather Association and American Meteorological Society annual meetings. Over the past eight years, nearly sixty students have participated in this program," states NCAS program director, Dr. Vernon Morris.

Providing an opportunity for the students is of the utmost importance for NCEP scientist and mentor Dr. DaNa Carlis who believes "the NCEP/NCAS partnership is important to fostering the idea that being a scientist can be a fun and rewarding career. The number of American scientists, especially African American, is dwindling and we have to open our doors for the students in order for them to gain interest and know that science is a career possibility. When I go out and speak to elementary and middle school age kids, they always enjoy the science demonstrations but during the teenage years we have to renew our focus on this age group because they're quickly becoming disinterested by science, and this is the reason why I'm excited about NCAS accepting high school students."

Much of the enjoyment is shared by the NCEP mentors who give of their time and energy to assist the students in achieving their career aspirations. The NCEP mentors include the following personnel: Dr. Krishna Kumar (NCO), Michelle Mainelli (NCO), Mike Davis (HPC), and Ed Danaher (HPC). Also, a special thanks to the EMC, NCO, and HPC directors, Dr. Bill Lapenta, Ben Kyger, and Dr. James Hoke for allowing this opportunity of growth for the leaders of tomorrow.

NOAA Center for Atmospheric Sciences at Howard University summer 2011 interns, from left to right: Jessica Narkiewicz (Stony Brook University), John Moore (Jackson State University), Karimar Ledesma Maldonado (University of Puerto Rico at Mayaguez), Emma Foley (Gustavus Adolphus College), Adam Schwantes (Northland College), Joe Puma (Glenbard West HS), Siddarth Plakkot (University of Maryland at College Park), and Stephanie Chavez (University of Texas at El Paso).
Service Center Activities
The IRI/CPC ENSO Prediction Plume: Forecasts of sea surface temperature (SST) anomalies from various dynamical and statistical models for the Niño 3.4 region (5°N-5°S, 120°W-170°W).
Click image to zoomClick image to zoom
Beginning in January 2012, the NCEP Climate Prediction Center (CPC) and the NOAA-funded International Research Institute (IRI) for Climate and Society will join forces to co-author the popular ENSO Diagnostics Discussion, which updates the public on the status and outlook for ENSO.
For nearly a decade, the IRI has created many popular ENSO products that have complemented the suite of ENSO services that CPC provides. One of IRI's most visible products is the IRI ENSO prediction plume that shows ~25 model forecasts for the Niño-3.4 region, NOAA's official ENSO index (an average of sea surface temperatures in the east-central equatorial Pacific Ocean). Now IRI and CPC will strengthen coordination on their ENSO products and discussions that are intended for both the general public and more technical audiences (see figure below for the "IRI/CPC ENSO prediction plume"). The strengthened collaboration will: (1) improve CPC-IRI forecast procedures for the production of the ENSO Diagnostics Discussion, (2) will lead to the development of new and improved tools that will aid ENSO monitoring and prediction, and (3) broaden the audience that both the IRI and CPC communicates with on ENSO. The ENSO Diagnostics Discussion can be found here: http://www.cpc.ncep.noaa.gov/products/analysis_monitoring/enso_advisory/
The IRI/CPC ENSO Prediction Plume: Forecasts of sea surface temperature (SST) anomalies from various dynamical and statistical models for the Niño 3.4 region (5°N-5°S, 120°W-170°W).

Google Earth imagery, overlaid with AWC's new automated jet stream analysis, which depicts jet stream heights, plus streamlines and isotachs.
Click image to zoomClick image to zoom
On November 29, the Aviation Weather Center (AWC) and NCEP's Central Operations (NCO) worked together with the United Kingdom Meteorological (UKMET) Office to implement the experimental World Area Forecast System (WAFS) cumulonimbus cloud, icing and turbulence forecasts to support an initiative from the international WAFS community to harmonize the WAFS aviation grids for those quantities.
Previous to the implementation, the two countries were producing grids from two different models, the UKMET global model and NCEP's Global Forecast System (GFS). This was confusing to the global user community, so the two countries worked together to blend their grids, giving users a choice between viewing a maximum or a mean of the two model sets. An example of the maximum turbulence grids at 35,000 feet is depicted in the attached Google Earth imagery, overlaid with AWC's new automated jet stream analysis, which depicts jet stream heights, plus streamlines and isotachs.
Google Earth imagery, overlaid with AWC's new automated jet stream analysis, which depicts jet stream heights, plus streamlines and isotachs.

View from the boat ridden to and from the training course each day.
Click image to zoomClick image to zoom
Joseph Sienkiewicz, NCEP's Ocean Prediction Center's (OPC) Ocean Application Branch Chief, conducted a training course sponsored by the European Organisation for the Exploitation of Meteorological Satellites (EUMETSAT), December 5-9, 2011, in Oostende, Belgium, a small port city on the North Sea coast.
The training course was centered on marine forecast applications of remotely sensed ocean surface vector winds (OSVW) from ASCAT and OSCAT and altimeter derived wave heights from JASON, JASON2, and ENVISAT. Fifteen participants from eleven countries attended the course. A short boat ride prior to and after class was the perfect transportation method for marine forecasters focused on winds and waves.

The premise of supporting such a training course by EUMETSAT is to have European Polar Satellite products better applied to issues of maritime safety. OPC and National Environmental Satellite Data and Information Service (NESDIS) scientists developed the case studies and provided much of the data cases. The National Advanced Weather Interactive Processing System (NAWIPS) was provided as the integrated display system for overlaying OSVW, altimeter wave heights, surface data, and numerical weather prediction forecast data on top of the Meteosat Second Generation RGB Airmass products.

For many of our European marine forecasters, this was their first experience with fully integrated display and product generation systems. Nearly all of them were unaware of the capabilities or had little experience using scatterometer winds and altimeter derived wave heights.

During the week, Joe and a MeteoFrance colleague, Stephane Liroli were also able to illustrate in real time the use of combinations of products due to a very intense cyclone passing to the north of Belgium on December 8-9 . Through collaborations with other trainers from European services, Joe was able to collect four excellent examples of case studies that can also be used by OPC forecasters for our GOES-R Proving Ground, OSVW, and Altimeter efforts.

EUMETSAT through the Ocean Sea Ice Satellite Applications Facility (OSI SAF) will be setting up a web forum as a vehicle to continue to communicate with forecasters and perhaps to serve as a vehicle for OPC and EU forecasters to share OSVW and altimeter experiences.

View from the boat ridden to and from the training course each day.

48-h probability of snowfall exceeding 12 inches by 00 UTC Monday 31 October 2011
Click image to zoomClick image to zoom
The first Hydrometeorological Prediction Center (HPC) Probabilistic Winter Precipitation Forecasts (PWPF) were introduced for the winter of 2004-2005.
These were delivered to the National Weather Service Weather Forecast Offices as AWIPS line graphics depicting slight, moderate, or high risk of snowfall exceeding 4, 8, or 12 inches and freezing rain exceeding 0.25 inch in 24 hours over the conterminous US (CONUS). The forecasts covered days 1.3 (72 hours). The HPC web page for Winter Weather (http://www.hpc.ncep.noaa.gov/wwd/winter_wx.shtml) displayed these from the very beginning.

For the winter of 2010-2011, HPC began production of experimental graphical and gridded PWPF covering the CONUS for 24-h accumulations through 72 hours. However, this is a much more extensive suite of products generated automatically using the HPC Winter Weather Desk deterministic forecasts along with an ensemble. The snowfall thresholds are 1, 2, 4, 6, 8, 12, and 18 inches. The freezing rainfall thresholds are 0.01, 0.10, 0.25, and 0.50 inch. HPC developed a user friendly web interface to access these products (http://www.hpc.ncep.noaa.gov/pwpf/wwd_accum_probs.php?fpd=24&ptype=snow).

Now, for the winter of 2011-2012, HPC has again expanded the PWPF product suite to include probabilities of exceeding thresholds for 48-h accumulations. For these products the snowfall thresholds are 2, 4, 8, 12, 18, 24, and 30 inches; for freezing rainfall the thresholds are 0.10, 0.25, 0.50, and 1.00 inch. The 48-h products are included in the display of 24-h PWPFs at the web link given above. The 48-h accumulation period allows users to quantify their risk for critical accumulation values. The example below is a 48-h probability of snowfall exceeding 12 inches by 00 UTC Monday 31 October 2011, a forecast for the early season snowstorm.

48-h probability of snowfall exceeding 12 inches by 00 UTC Monday 31 October 2011

Image showing the U.S. and UK flags along with a solar image.
Click image to zoomClick image to zoom
The Space Weather Prediction Center (SWPC) held a joint US-United Kingdom (UK) workshop on space weather October 11-13, 2011.
The workshop was motivated by the visibility space weather received during President Obama's visit to the UK and his conversations with UK Prime Minister Cameron about joint US-UK collaborations in this area. The objective of the workshop was to identify key operational space weather needs and requirements and develop a research roadmap that would address those requirements. These research activities will benefit both the US space weather forecast office as well as the fledgling space weather services currently being developed in the UK. With nearly 50 scientists and forecasters from both US and UK agencies and institutions in attendance, the workshop achieved its intended goals.
Image showing the U.S. and UK flags along with a solar image.

Initial collaborative activities have begun and plans are being made for more extensive and broader cooperation. Some of the important research plans included: the need for understanding and modeling interplanetary magnetic fields within transient structures such as Coronal Mass Ejections (CMEs); the need for better coupling between the magnetospheric models and the ionosphere/thermosphere systems; and the need for better understanding of the impacts of lower atmospheric weather on the near-Earth space environment.

Numerous data issues were also identified and discussed. These include the need to share and expand our ground-based geomagnetic field measurements to support both customers and model developers. The need for better heliospheric (the area between the sun and the earth) measurements was recognized as critical. The use of data assimilation to improve forecasts was also recognized as an area where effort needs to be expended. In the troposphere and ionosphere/thermosphere, data assimilation has been used very successfully. It is speculated that its use could bring similar improvements to the magnetosphere and heliosphere model accuracy as well. Finally, a follow-on meeting in the UK is also being planned so that we can build upon the momentum that the initial workshop has generated.


Dashboard product valid 20Z, January 10, 2012
Click image to zoomClick image to zoom
The Aviation Weather Center (AWC) has developed an Experimental Aviation Winter Weather Dashboard.
This dashboard displays guidance that conveys the potential of winter weather impact to the FAA's Core 30 airports (with the exception of Honolulu). Core 30 airports are those with significant activity serving major metropolitan areas and also serve as hubs for airline operations. The impact information for the dashboard is calculated entirely from NCEP's operational Short-Range Ensemble Forecast (SREF) system. Updated four times per day, the web display shows the potential impact to each airport through a matrix of color coded boxes that depict nominal (green), slight (yellow), moderate (orange), and high (red) impact through eighty-seven forecast hours.

The dashboard was developed as a request from the multi-agency/industry Collaborative Decision Making/Weather Evaluation Team (CDM/WET). AWC meteorologists collaborated with the team during the development cycle, providing feedback and guidance on the implementation of the scientific model used to calculate winter weather impact and the design of the web interface. The experimental dashboard was made available on the AWC's Aviation Weather Testbed (AWT) site on December 1, 2011. It is intended as a high-level guidance and briefing tool primarily for operational aviation meteorologists as well as air traffic managers, dispatchers, and the Air Traffic Control System Command Center (ATCSCC). Its target decision support range is for long-term air traffic planning during weather events. The dashboard can be viewed at http://testbed.aviationweather.gov/winterdashboard/.

Dashboard product valid 20Z, January 10, 2012

December 2011 - February 2012 Precipitation Outlook:  Shaded areas are favored to have above average (green) or below average (brown) precipitation.
Click image to zoomClick image to zoom
After a summer hiatus, the tropical Pacific phenomenon known as La Niña returned in August 2011.
Every year NOAA monitors environmental conditions and provides operational forecasts of climate anomalies such as La Niña and their associated impacts to assist interagency efforts to prepare and respond. Climate outlooks through next spring anticipate greater than normal chances for a colder and wetter pattern to develop in the northern Missouri basin as a result of La Niña. Resulting impacts include increases in the potential for major flooding in the north-central U.S. in the spring and summer of 2012 and for ongoing drought conditions over the south-central U.S.

As of November 2011, decision makers from Montana to Texas are working to prepare for these possibilities. Might we see a repeat performance of last winter's infamous snows in the headwaters of the Missouri, and major flooding later in the year? There is heightened concern about flooding within the Missouri Basin due to the significant damage to infrastructure, ecosystems and other socio-cultural impacts in 2011. Will the spring and summer of 2012 feature a continuation of drought conditions in the Southern Great Plains? How can we be better prepared for potential high impact weather and climate extremes in the upcoming months?

December 2011 - February 2012 Precipitation Outlook:  Shaded areas are favored to have above average (green) or below average (brown) precipitation.
December 2011 - February 2012 Precipitation Outlook: Shaded areas are favored to have above average (green) or below average (brown) precipitation.

Beginning in November, 2011, the National Climate Predictions and Projections Platform and CPC began conducting a La Niña Missouri Basin Pilot Project to provide climate information at regional scales for the Missouri Basin. The climate information will include CPC outlooks for two weeks to several seasons and possibly beyond. Pilot activities will include webinars and in-person briefings aimed at federal, tribal, state and local governments, businesses, and the media, and an evaluation component. A website (http://www.esrl.noaa.gov/cog/lanina/) will be updated regularly to announce the webinars, and will provide links to feedback and discussion forums, archived briefings, relevant articles, and links to forecast information and relevant information portals.

The webinars and the other planned events and activities, such as a Town Hall meeting during the AMS annual meeting in January 2012, discussion and feedback forums, allow producers and users of NOAA climate information an opportunity to talk directly and discuss concerns and needs, including the short and long-term implications of forecasts and climate events. The information is intended to inform planning and decision-making by federal agencies, tribes, state and local governments, businesses and other organizations with interests in the basin.

The first webinar was held Friday November 18th at 11am CST. See "Webinars" and other links on the web page link above to access this information.


The NHC Facebook page as Major Hurricane Irene approached the Bahamas.
Click image to zoomClick image to zoom
Earlier this year, NOAA's National Hurricane Center began a page on Facebook. Every morning during the hurricane season, postings regarding tropical cyclone development potential were provided.
More frequent updates were provided whenever a tropical cyclone was present in either the eastern North Pacific basin or the Atlantic basin.

But it was during Hurricane Irene when the NHC Facebook page took off. Over a nine-day period, it had 6.4 million views as well as 8,000 comments and likes. Subscribers increased nearly 68,000 during the event, with the largest increase of 15,000 occurring on the day NHC issued the first Hurricane Watch for a portion of the U.S. NHC Facebook subscribers surpassed the 100,000 mark the next day.

It's a big success story and one that NHC plans to continue in 2012.

The NHC Facebook page as Major Hurricane Irene approached the Bahamas.

Image of Wichita Mountains Wildlife Refuge showing bison foraging.
Click image to zoomClick image to zoom
Oklahoma is prone to natural disasters and in 2011 alone, the state experienced EF5 tornadoes, flash floods, raging wildfires, drought, record-breaking heat and cold, and even a 5.6 magnitude earthquake!
Image of Wichita Mountains Wildlife Refuge showing bison foraging.

But did you know that the Wichita Mountain Wildlife Refuge in southwestern Oklahoma has over 1.9 million visitors annually? In the past year, this park experienced a wildfire that burned over 59,000 acres and a tornado in November. Park officials recalled full tour buses to the Refuge Visitor Center during the November tornado warnings and eventually told them to return another day as "today is not a good day to hike."

So how weather "aware" are individuals when you set out for a long hike, especially in state and federal parks? That's what a team of meteorologists at the Storm Prediction Center (SPC) and Weather Forecast Office (WFO) Norman hope to discover. If 1.9 million individuals visit just one park in Oklahoma annually, imagine how many visit the hundreds of state and federal parks across the country.

In early December, a team of SPC and WFO Norman meteorologists met with park officials from the U.S. Fish & Wildlife Service. They brought a prototype weather awareness bulletin board to be displayed in the visitor.s center. The reaction from park officials was overwhelmingly positive, especially given their knowledge of vulnerable campsites and trails plus the weather-related rescues needed in the past year.

At the meeting, it was agreed that a magnetic bulletin board will be placed in the entryway of the Refuge Visitor Center, with an additional weather-proof board placed at a popular campsite within the park. The bulletin boards will display weather hazard icons that can be changed daily by the park officials, based on information provided by the NWS. For example, a simple headline of "Will there be thunderstorms today?" would include a YES or NO magnet, with a YES showing which of the following threats existed that day: lightning, hail, severe winds, or tornadoes. Additionally, WFO Norman will provide a NOAA weather radio at the campsite, so that campers can check for the latest hazardous weather information, without stopping in at the visitor's center.

The bulletin boards will be placed in the park by early March, prior to spring break when the number of visitors to the park rapidly increases. If the pilot project is deemed successful, additional weather information may be added at the head of the more popular trails, and the program likely expanded to additional parks in Oklahoma.


CPC African Desk Coordinator Wassila Thiaw leading a climate discussion with African Desk staff and trainees.  Seated from left to right: Amira Ibrahim, Awatif Mostafa, Aaron Ntiranyibagira, and Lotfi Khammari. Standing: Endalkachew Bekele and Vadlamani Kumar.
Click image to zoomClick image to zoom
The Department of State hosted a U.S. Center at the UNFCCC Conference of the Parties (COP) held in Durban, South Africa, 28 November - 9 December 2011.
The objective of the US Center at COP is to showcase U.S. engagement and actions on climate change. The three themes for COP-17 were: (1) Engagement in Africa; (2) Taking action at home; (3) World leadership in climate science and technology.

The Climate Prediction Center (CPC), Geophysical Fluid Dynamics Lab (GFDL), and the Climate Program Office (CPO), in collaboration with the National Center for Atmospheric Research (NCAR) formed a panel for a side event on "Advances in Climate Modeling for Improved Decision Support Systems." The event was introduced and moderated by CPO. While the GFDL and NCAR presentations focused on advances in climate change modeling, CPC discussed applications of operational climate models with an emphasis on climate information and capacity building. The presentation highlighted the various decision support tools developed at NCEP in support of weather and climate institutions in Africa and US agencies engaged in Africa. The use of these tools in drought and flood outlooks, and in emergency response planning such as food security was also discussed. The presentation addressed NCEP's engagement in capacity building for African institutions to better understand climate variability and change. Discussions focused on both the residency training program (see picture), part of the US contribution to the World Meteorological Organization (WMO) Voluntary Cooperation Program (VCP), and the global climate training workshop series, produced in collaboration with the United States Agency for International Development (USAID) and the WMO. Finally the presentation highlighted the need for data to improve climate models and also CPO's lead role in building the observing system in the Indian Ocean to improve predictability.

The side event was well attended with questions and comments ranging from uncertainties in the models to adequately represent regional climate to data and the biggest challenges to improve models. The side event was also an opportunity to meet other stakeholders interested in NCEP products and in capacity building. The UN Economic Commission for Africa and the USAID office in South Africa are particularly interested in follow up discussions to leverage efforts in Africa.

CPC African Desk Coordinator Wassila Thiaw leading a climate discussion with African Desk staff and trainees.  Seated from left to right: Amira Ibrahim, Awatif Mostafa, Aaron Ntiranyibagira, and Lotfi Khammari. Standing: Endalkachew Bekele and Vadlamani Kumar.
CPC African Desk Coordinator Wassila Thiaw leading a climate discussion with African Desk staff and trainees. Seated from left to right: Amira Ibrahim, Awatif Mostafa, Aaron Ntiranyibagira, and Lotfi Khammari. Standing: Endalkachew Bekele and Vadlamani Kumar.

Space Weather Forecasters Monty Spencer (foreground) and Jeff Stankiewicz (background) analyze space weather data in the new SWPC Forecast Center.
Click image to zoomClick image to zoom
The Space Weather Prediction Center (SWPC) recently completed a modernization of its operational forecast center.
The forecast center modernization included updates to all IT infrastructure, improving the reliability of the systems and increasing the forecasters' ability to display and interpret more space weather data in real-time. As a part of the modernization, the infrastructure needed for a migration to the Advanced Weather Interactive Processing System (AWIPS) was completed as well. AWIPS is an information processing, display, and telecommunications system used by the National Weather Service to display data, produce products and transmit them to the public. This work will pave the way for SWPC's transition to the AWIPS system in the near future. Additionally, the new design addressed many outstanding ergonomic concerns resulting in significant improvement in the working conditions and usability for the space weather forecasters.
Space Weather Forecasters Monty Spencer (foreground) and Jeff Stankiewicz (background) analyze space weather data in the new SWPC Forecast Center.

Image of old paper-based forecast.
Click image to zoomClick image to zoom
A few years ago when plans began to take shape for the move from the old World Weather Building (WWB) to the new NOAA Center for Weather and Climate Prediction (NCWCP), the Hydrometeorological Prediction Center (HPC) faced a decision:
What could be done about the paper archive of old forecasts and analyses dating back many years, stacked on shelves and in drawers on the fourth floor? It could not be moved to the NCWCP as there would be no room for it there. Some of it could be thrown away because the information was duplicated in archives elsewhere, but the surface analyses and the Quantitative Precipitation Forecasts (QPF) had to be kept to perpetuate a record extending back as far as possible. Creating a digital archive was the answer. Thus began the effort to scan the paper charts creating digital copies in Portable Document Format (PDF) files. As time permitted, a HPC Meteorological Technician and forecasters took turns scanning charts. Also, as part of the effort, surface analyses available only on microfiche (an archaic hardcopy medium) were scanned. The surface analysis digital archive is now nearly complete from 1949 to the present. An example image below shows the surface analysis valid at 12 UTC 11 February 1983, depicting a developing major east coast snowstorm.

Work on scanning the QPF archive continues. Most of the forecasts from 1990 through 1997 have been digitized. Maps will be scanned back into the 80s, as time permits. The QPF archive contains not only the human QPF but also the verifying manual analysis and guidance fields from several models used at the time. For example, circa 1990 the guidance consisted of the Limited Fine-Mesh (LFM) model, the Primitive Equation (PE) model, and the newly minted Regional Analysis and Forecast System (RAFS), which used the Nested Grid Model (NGM). Once the scanning is complete and adequate storage is available, HPC plans to make these products available online.

Image of old paper-based forecast.

U.S. Senator Bill Nelson (D.-Fla.) and NOAA National Hurricane Center Director Bill Read speak to the media regarding proposed funding cuts to NOAA's hurricane hunter program.
Click image to zoomClick image to zoom
U.S Senator Bill Nelson (D - Fla.) visited NOAA's National Hurricane Center (NHC) on September 1st. An avid weather enthusiast, Nelson met with NHC Director Bill Read, Deputy Director Ed Rappaport and Hurricane Research Division Director Frank Marks.
A 15-minute tour of the NHC operations area followed, where the Senator was briefed by several hurricane specialists regarding Hurricane Katina and a developing system in the Gulf of Mexico.

The Senator and Read then met with the media, driving home the importance of NOAA's hurricane hunter program and how detrimental to accurate forecasting any cutbacks to the program would be.

U.S. Senator Bill Nelson (D.-Fla.) and NOAA National Hurricane Center Director Bill Read speak to the media regarding proposed funding cuts to NOAA's hurricane hunter program.

Dr. Tom Bogdan explains the importance of space weather and relays how it has the potential to disrupt every major public infrastructure system.
Click image to zoomClick image to zoom
Department of Commerce Secretary John Bryson paid a short visit to the Boulder Department of Commerce Campus on November 8, 2011.
Space Weather Prediction Center (SWPC) Director Tom Bogdan joined a select group of scientists and administrators from NOAA, the National Institute of Standards and Technology (NIST), and National Telecommunications and Information Administration (NTIA) for lunch with the Secretary, where they learned of his desire to transform research and development accomplishments into jobs and economic prosperity for the nation. Afterwards, Mr. Bryson had the opportunity to stop by the Space Weather Forecast Office and talk with one of our forecasters, Ken Tegnell, about the challenges of delivering space weather products and services to a rapidly evolving high-tech customer base. Space weather was obviously new to him and he was very much interested and intrigued with the subject.
Dr. Tom Bogdan explains the importance of space weather and relays how it has the potential to disrupt every major public infrastructure system.

The NHC media room during Hurricane Irene as the storm approached the Northeast.
Click image to zoomClick image to zoom
Hurricane Irene was the lone hurricane to hit the United States in 2011, and the first one to do so since Ike struck southeast Texas in 2008.

When NOAA's National Hurricane Center issued the Hurricane Watch for a portion of the U.S., NHC opened its media pool, alerting all national TV outlets and every network-affiliated TV station along the U.S. East coast to the availability of live interviews regarding the approaching hurricane.

Over the four day period of the pool, nearly 150 live interviews were provided at the hurricane briefing desk to national and local TV outlets by NHC Director Bill Read, Deputy Director Ed Rappaport and several hurricane specialists.

A dozen radio and TV stations sent correspondents on site to NHC, with updates and interviews from the media room.

The NHC media room during Hurricane Irene as the storm approached the Northeast.
In This Issue...
RTOFS - Global Implementation
HWRF System
NAM Upgrade
Contract Awarded for New Weather and Climate Supercomputer
COPC Network Expansion
NCWCP Update
NCEP Summer Interns
ENSO Discussion Collaboration
Blended WAFS Products
EUMETSAT Training
HPC PWPF 2011-12
UK Space Weather Workshop
Experimental AWWD
La Niña Missouri Basin Pilot Project
NHC Facebook Page
Hazardous Weather Pilot Project
COP-17 Presentation Summary
SWPC Remodel
HPC Scanning
Senator Nelson Visits NHC
Commerce Secretary Visits SWPC
Media Descends on NHC