Contact Us:
- National Center for Health Statistics
3311 Toledo Rd
Hyattsville, MD 20782 - 1 (800) 232-4636
- Contact CDC–INFO
NCHS Data Brief
Number 94, May 2012
Trends in Asthma Prevalence, Health Care Use, and Mortality in the United States, 2001–2010
On This Page
- Key findings
- Asthma prevalence increased from 2001 to 2010 and is now at its highest level.
- Asthma prevalence was higher among children, females, and those with family income below the poverty level, and differed by race and ethnicity for the period 2008–2010.
- Asthma health care encounters per 100 persons with asthma declined in primary care settings and were stable for emergency department (ED) visits and hospitalizations, while asthma death rates per 1,000 persons with asthma declined.
- For the period 2007–2009, asthma health care encounters per 100 persons with asthma varied by demographic characteristics.
- Asthma death rates per 1,000 persons with asthma were higher for females, black persons, and adults.
- Summary
- Definitions
- Data sources and methods
- About the authors
- References
- Suggested citation
PDF Version (681 KB)
Lara J. Akinbami, M.D.; Jeanne E. Moorman, M.S.; Cathy Bailey, M.S.; Hatice S. Zahran, M.D.; Michael King, Ph.D.; Carol A. Johnson, M.P.H.; and Xiang Liu, M.Sc.
Key findings
- Asthma prevalence increased from 7.3% in 2001 to 8.4% in 2010, when 25.7 million persons had asthma.
- For the period 2008–2010, asthma prevalence was higher among children than adults, and among multiple-race, black, and American Indian or Alaska Native persons than white persons.
- From 2001 to 2009, health care visits for asthma per 100 persons with asthma declined in primary care settings, while asthma emergency department (ED) visit and hospitalization rates were stable.
- For the period 2007–2009, black persons had higher rates for asthma ED visits and hospitalizations per 100 persons with asthma than white persons, and a higher asthma death rate per 1,000 persons with asthma. Compared with adults, children had higher rates for asthma primary care and ED visits, similar hospitalization rates, and lower death rates.
Asthma is a common chronic airway disorder characterized by periods of reversible airflow obstruction known as asthma attacks (1). Airflow is obstructed by inflammation and airway hyperreactivity (contraction of the small muscles surrounding the airways) in reaction to certain exposures (1). Exposures include exercise, infection, allergens (e.g., pollen), occupational exposures (e.g., chemicals), and airborne irritants (e.g., environmental tobacco smoke) (1). Symptoms may include wheezing, coughing, shortness of breath, and chest tightness (1). It is not clear how to prevent asthma from developing and there is no cure (1). Yet the means to control and prevent exacerbations in persons who have asthma are well established in evidence-based clinical guidelines (1). This report presents recent data for trends in asthma prevalence, health care encounters, and mortality.
Keywords: lung disease, National Health Interview Survey, National Health Care Surveys, National Vital Statistics System
Asthma prevalence increased from 2001 to 2010 and is now at its highest level.
Figure 1. Asthma prevalence in the United States, 2001–2010

NOTES: Asthma prevalence refers to percentage of people who have ever been diagnosed with asthma and still have asthma. Data are age adjusted to the 2000 U.S. standard population. Access data table for Figure 1 [PDF - 138 KB].
SOURCE: CDC/NCHS, National Health Interview Survey.
Asthma prevalence (the percentage of people who have ever been diagnosed with asthma and still have asthma) increased from 7.3% in 2001 to 8.4% in 2010 (Figure 1). In 2010, an estimated 25.7 million people had asthma: 18.7 million adults aged 18 and over, and 7.0 million children aged 0–17 years.
Asthma prevalence was higher among children, females, and those with family income below the poverty level, and differed by race and ethnicity for the period 2008–2010.
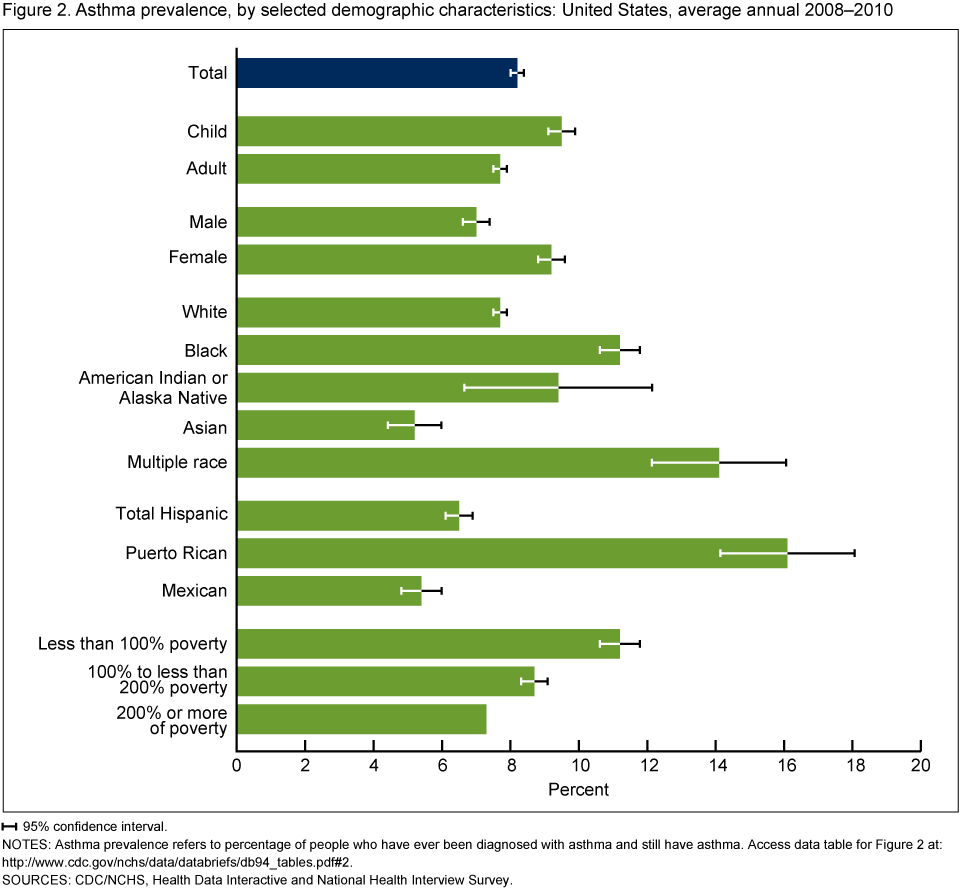
Children aged 0–17 years had higher asthma prevalence (9.5%) than adults aged 18 and over (7.7%) for the period 2008–2010 (Figure 2). Females had higher asthma prevalence than males (9.2% compared with 7.0%).
Among racial groups, persons of multiple race had the highest asthma prevalence (14.1%), while Asian persons had the lowest rates (5.2%). Persons of black (11.2%) and American Indian or Alaska Native (9.4%) races had higher asthma prevalence compared with white persons (7.7%). Among Hispanic groups, asthma prevalence was higher among persons of Puerto Rican (16.1%) than Mexican (5.4%) descent.
Figure 2. Asthma prevalence, by selected demographic characteristics: United States, average annual 2008–2010
![]() 95% confidence interval.
95% confidence interval.
NOTES: Asthma prevalence refers to percentage of people who have ever been diagnosed with asthma and still have asthma. Access data table for Figure 2.
SOURCES: CDC/NCHS, Health Data Interactive and National Health Interview Survey.
Asthma prevalence was higher for groups with lower income-to-poverty level ratios: While 11.2% of those with incomes less than 100% of the poverty level had asthma, asthma prevalence was 8.7% for persons with incomes 100% to less than 200% of the poverty level, and 7.3% for persons with incomes at least 200% of the poverty level.
Asthma health care encounters per 100 persons with asthma declined in primary care settings and were stable for emergency department (ED) visits and hospitalizations, while asthma death rates per 1,000 persons with asthma declined.
Asthma visits in primary care settings (physician offices and hospital outpatient departments) per 100 persons with asthma declined from 2001 to 2009 (Figure 3). Asthma ED visits and hospitalizations per 100 persons with asthma were stable from 2001 to 2009. Asthma death rates per 1,000 persons with asthma declined from 2001 to 2009.
Figure 3. Asthma health care encounters per 100 persons with asthma, and asthma deaths per 1,000 persons with asthma: United States, 2001–2009
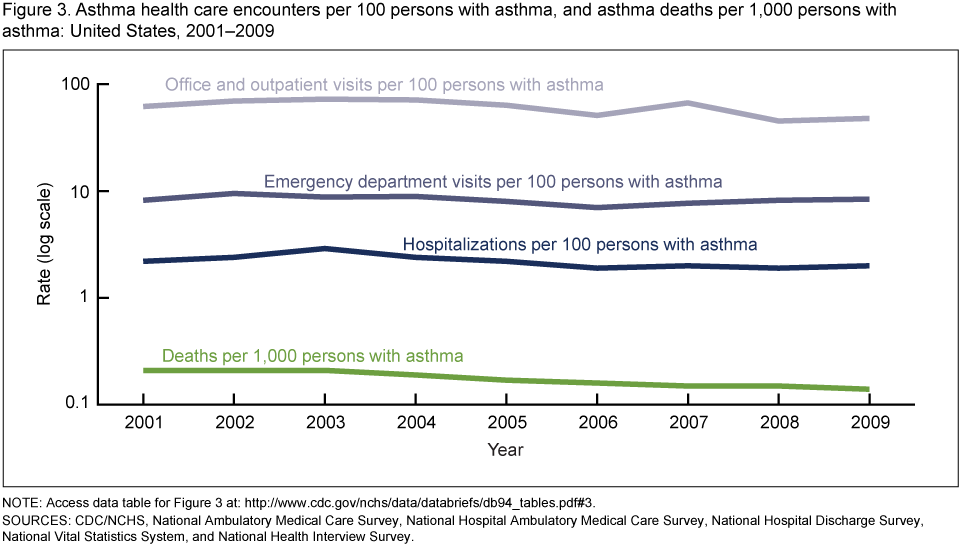
NOTE: Access data table for Figure 3.
SOURCES: CDC/NCHS, National Ambulatory Medical Care Survey, National Hospital Ambulatory Medical Care Survey, National Hospital Discharge Survey,
National Vital Statistics System, and National Health Interview Survey.
For the period 2007–2009, asthma health care encounters per 100 persons with asthma varied by demographic characteristics.
The rates of health care encounters per 100 persons with asthma across all health care settings (Figure 4) were similar for males and females, and for black and white persons, but the rate for children was higher than that for adults.
Asthma encounter rates for each setting (primary care, ED, and hospital) were also similar for males and females (Figure 4).
Asthma visit rates in primary care settings per 100 persons with asthma were similar for black and white persons. However, black persons had a higher asthma ED visit rate and a higher asthma hospitalization rate than white persons.
Figure 4. Asthma health care encounters per 100 persons with asthma: United States, 2001–2009

NOTE: Access data table for Figure 4.
SOURCES: CDC/NCHS, National Ambulatory Medical Care Survey, National Hospital Ambulatory Medical Care Survey, National Hospital Discharge Survey, and National Health Interview Survey.
Children aged 0–17 years with asthma had a higher asthma visit rate for primary care settings and a higher ED visit rate than adults aged 18 and over. Asthma hospitalization rates per 100 persons with asthma were similar between adults and children.
Asthma death rates per 1,000 persons with asthma were higher for females, black persons, and adults.
The asthma death rate per 1,000 persons with asthma was 0.15 for the period 2007–2009. Asthma death rates per 1,000 persons with asthma were more than 30% higher for females than males, 75% higher for black persons than white persons, and almost seven times higher for adults than children. The highest rate was for adults aged 65 and over (0.58 per 1,000 persons with asthma) (Figure 5).
Figure 5. Asthma deaths per 1,000 persons with asthma, by selected demographic characteristics: United States, average annual 2007–2009

NOTE: Access data table for Figure 5.
SOURCES: CDC/NCHS, National Vital Statistics System and National Health Interview Survey.
Summary
Asthma prevalence increased from 2001 to 2010: An estimated 25.7 million persons had asthma in 2010. Certain demographic groups had higher asthma prevalence: children aged 0–17 years, females, black persons, persons of multiple race, Puerto Rican persons, and persons with a family income below the poverty level. This report examines rates for asthma outcomes (health care encounters and death) for persons with asthma rather than for the general population. Rates for the general population represent the burden of asthma in the United States. Rates for the population with asthma take into account changes in asthma prevalence over time and differences in asthma prevalence among demographic groups. From 2001 to 2009, rates for ED visits and hospitalizations per 100 persons with asthma remained stable, while rates for asthma visits in primary care settings (physician offices or hospital outpatient departments) and asthma deaths declined. For the period 2007–2009, asthma visit rates (per 100 persons with asthma) in primary care settings for black persons were similar to those for white persons, but rates for asthma ED visits, hospitalizations, and death (per 1,000) were higher. Compared with adults, children aged 0–17 years had a higher rate for asthma visits in primary care settings and EDs, but had a similar hospitalization rate and a lower asthma death rate.
Definitions
Asthma prevalence: Based on an affirmative response to the following National Health Interview Survey (NHIS) questions: For adults, "Have you ever been told by a doctor or other health professional that you had asthma?" and "Do you still have asthma?"; and for children, "Has a doctor or other professional ever told you that [sample child] had asthma?" and "Does [sample child] still have asthma?"
Poverty status or percentage of poverty level: Based on family income, family size, and the number of children in the family, and for families with two or fewer adults, on the age of the adults in the family. The poverty level is based on a set of income thresholds that vary by family size and composition. Families or individuals with income below their appropriate thresholds are classified as below the poverty level. These thresholds are updated annually by the U.S. Census Bureau to reflect changes in the Consumer Price Index for all urban consumers (2). Estimates by poverty status from NHIS are based on both reported and imputed family income (3).
Asthma health care encounter: Based on an International Classification of Diseases, Ninth Revision, Clinical Modification (ICD–9–CM) code of 493 as the first-listed diagnosis from the National Ambulatory Medical Care Survey (NAMCS), National Hospital Ambulatory Medical Care Survey (NHAMCS), and National Hospital Discharge Survey (NHDS). For this report, office visits and outpatient department visits were combined because both occur in primary care (nonemergent) settings.
Asthma death: Based on an ICD–10 code of J45 or J46 as the underlying cause of death from the National Vital Statistics System (NVSS).
Data sources and methods
NHIS data were used to estimate asthma prevalence. NHIS collects information about the health and health care of the civilian noninstitutionalized U.S. population. Data for this report were taken from the sample adult and sample child components that collect detailed information about health conditions, including asthma, for a randomly selected adult or child. For further information about NHIS including the questionnaire, see the NHIS website.
NAMCS data were used to estimate visits to private physician offices. NAMCS is an annual probability survey of nonfederal office-based physicians who provide direct patient care in the 50 states or the District of Columbia, excluding radiologists, anesthesiologists, and pathologists. Patient information is abstracted from medical records and includes demographics, diagnoses, medications, and procedures. Additional information can be found on the Ambulatory Health Care Data website.
NHAMCS data were used to estimate visits to hospital outpatient departments and hospital EDs. NHAMCS is a national probability sample survey of in-person visits made to EDs and outpatient departments of nonfederal short-stay hospitals in the United States. Patient information is collected from medical records and includes demographics, diagnoses, medications, and procedures. More information can be found at the Ambulatory Health Care Data website.
NHDS data were used to estimate inpatient hospitalizations. NHDS collects information from a national sample of inpatient stays in nonfederal short-stay hospitals in the United States. Patient information is collected from medical records and automated data files and includes demographics, length of stay, diagnoses, and procedures. For more information, visit the NHDS website.
The mortality component of NVSS data was used to calculate asthma death rates. Data are based on information from all death certificates filed in the 50 states and District of Columbia. For more information, visit the NVSS Mortality Data website.
Data from NHIS, NAMCS, NHAMCS, and NHDS are based on nationally representative samples. For these surveys, sample weights are used to produce national estimates. Data-weighting procedures are described in more detail elsewhere (4–6). Point estimates and estimates of corresponding variances for this analysis were calculated using SUDAAN software (7) to account for the complex sample designs of each survey. The Taylor series linearization method was used for variance estimation.
Differences between percentages and rates were evaluated using two-sided significance tests at the 0.05 level. Terms such as "higher than" and "less than" indicate statistically significant differences. Terms such as "similar" and "no difference" indicate that the statistics being compared were not significantly different. Lack of comment regarding the difference between any two statistics does not necessarily suggest that the difference was tested and found to be not significant.
Rates in this report are expressed relative to the estimate of the number of people with asthma from NHIS, and, therefore, account for prevalence differences over time and among subgroups. This approach is in contrast to the more common presentation of rates for the general population that reflect the overall burden of asthma in the United States. Population-based rates do not take into account increasing asthma prevalence over time or prevalence differences among demographic groups. Rates per 100 persons with asthma, however, can be used to directly compare the risk of an outcome (e.g., hospitalization or death) for subgroups due to factors other than a difference in current asthma prevalence. The population reference group for the prevalence estimates (civilian noninstitutionalized population) is different than the reference groups for hospital data (civilian population) and for mortality data (residential population). Therefore, the rates per 100 with asthma for these two outcomes may be slightly overestimated. Standard errors for the asthma-specific rates, which use the number of persons with asthma in the denominator rather than a population constant, were calculated using formulae for ratios assuming that covariance equals zero (8).
All estimates shown in this report have a relative standard error less than or equal to 30%. Trends were tested with weighted least squares regression models of the log of each outcome using Joinpoint software (9) to determine whether an apparent change over time was statistically significant, taking into account the standard error for each data point.
About the authors
Lara J. Akinbami and Xiang Liu are with the Centers for Disease Control and Prevention's (CDC) National Center for Health Statistics, Office of Analysis and Epidemiology. Jeanne E. Moorman, Cathy Bailey, Hatice S. Zahran, Michael King, and Carol A. Johnson are with CDC's National Center for Environmental Health and the National Asthma Control Program.
References
- National Heart, Lung, and Blood Institute, National Institutes of Health. National Asthma Education and Prevention Program. Expert Panel Report 3: Guidelines for the diagnosis and management of asthma. NIH Publication No. 07–4051. 2007.
- U.S. Census Bureau. Poverty. 2011.
- Schenker N, Raghunathan TE, Chiu PL, et al. Multiple imputation of family income and personal earnings in the National Health Interview Survey: Methods and examples [PDF - 365 KB]. National Center for Health Statistics. 2010.
- Botman SL, Moore TF, Moriarity CL, Parsons VL. Design and estimation for the National Health Interview Survey, 1995–2004. National Center for Health Statistics. Vital Health Stat (2)130. 2000.
- National Center for Health Statistics. Ambulatory Health Care Data: Estimation procedures. [Accessed 1/25/12].
- Dennison C, Pokras R. Design and operation of the National Hospital Discharge Survey: 1988 redesign. National Center for Health Statistics. Vital Health Stat 1(39). 2000.
- SUDAAN, release 10.0 [computer software]. Research Triangle Park, NC: RTI International. 2008.
- Kish L. Survey Sampling. 1st ed. New York, NY: John Wiley & Sons, Inc. 1965.
- National Cancer Institute. Joinpoint regression program. 2011.
Suggested citation
Akinbami LJ, Moorman JE, Bailey C, et al. Trends in asthma prevalence, health care use, and mortality in the United States, 2001–2010. NCHS data brief, no 94. Hyattsville, MD: National Center for Health Statistics. 2012.
Copyright information
All material appearing in this report is in the public domain and may be reproduced or copied without permission; citation as to source, however, is appreciated.
National Center for Health Statistics
Edward J. Sondik, Ph.D., Director
Jennifer H. Madans, Ph.D., Associate Director for Science
Office of Analysis and Epidemiology
Jennifer H. Madans, Ph.D., Acting Associate Director
