
|
 |

 |
 |
 |
 |
helps students visualize abstract statistical concepts and see dynamic processes behind the gathering, analysis, and interpretation of statistics. Each sample activity includes instructions, teaching tips, assessment ideas, and references. In one activity, students design an blind taste test of two sodas. In another, students learn that larger sample sizes produce better estimates and develop an appreciation for factors affecting sampling variability. (SERC, National Science Foundation)
 |
 |
 |
 |
 |
 |
The Coke vs. Pepsi Taste Test Challenge has students design and carry out an experiment to determine whether or not students are able to correctly identify two brands of cola in a blind taste test. This activity allows students to gain a better understanding of the experimental process and causality through considering control, random assignment, and possible confounding variables. |
 |
 |
 |
 |
 |
|
 

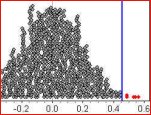
Testing a correlation with fathom |
 |
|
 |


 Privacy
  Security
  Disclaimer
  WhiteHouse.gov
  USA.gov
