On This Page
- Estimation Methods
- Prevalence of diagnosed and undiagnosed diabetes in the United States, all ages, 2007
- Prevalence of diagnosed and undiagnosed diabetes among people aged 20 years or older, United States, 2007
- Prevalence of diagnosed diabetes in people younger than 20 years of age, United States, 2007
- Race and ethnic differences in prevalence of diagnosed diabetes
- Incidence of diagnosed diabetes among people aged 20 years or older, United States, 2007
- Incidence of diagnosed diabetes in people younger than 20 years of age, United States, 2002–2003
- Deaths among people with diabetes, United States, 2006
- Complications of diabetes in the United States
- Preventing diabetes complications
- Estimated diabetes costs in the United States in 2007
2007 National Diabetes Fact Sheet
Historical
This webpage is archived for historical purposes and is no longer being maintained or updated.
Return to the Table of Contents
Estimation Methods
The diabetes estimates in this fact sheet were derived from various data systems of the Centers for Disease Control and Prevention (CDC), the user population database of the Indian Health Service (IHS), the U.S. Renal Data System of the National Institutes of Health (NIH), the U.S. Census Bureau, and published studies. Estimates of the total number of persons with diabetes and the prevalence of diabetes in 2007 were derived using 2003–2006 National Health and Nutrition Examination Survey (NHANES), 2004–2006 National Health Interview Survey (NHIS), 2005 IHS data, and 2007 resident population estimates. Many of the estimated numbers and percentages of people with diabetes were derived by applying diabetes prevalence estimates from health surveys of the civilian, noninstitutionalized population to the most recent 2007 resident population estimates. These estimates have some variability due to the limits of the measurements and estimation procedures. The procedures assumed that age-race-sex–specific percentages of adults with diabetes (diagnosed and undiagnosed) in 2007 are the same as they were in earlier time periods (e.g., 2003–2006), and that the age-race-sex–specific percentages of adults with diabetes in the resident population are identical to those in the civilian, noninstitutionalized population. Deviations from these assumptions may result in over- or under-estimated numbers and percentages. For further information about the methods for deriving total, diagnosed, and undiagnosed diabetes prevalence from NHANES data, see http://www.cdc.gov/mmwr/preview/mmwrhtml/mm5235a1.htm. More detail on the data sources, references, and methods are available at http://www.cdc.gov/diabetes/pubs/references07.htm.
Prevalence of diagnosed and undiagnosed diabetes in the United States, all ages, 2007
Total: 23.6 million people or 7.8% of the population have diabetes.
Diagnosed: 17.9 million people
Undiagnosed: 5.7 million people
Prevalence of diagnosed and undiagnosed diabetes among people aged 20 years or older, United States, 2007
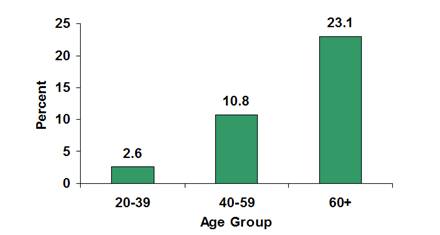
Age 20 years or older: 23.5 million or 10.7% of all people in this age group have diabetes.
Age 60 years or older: 12.2 million or 23.1% of all people in this
age group have diabetes.
Men: 12.0 million or 11.2% of all men aged 20 years or older have diabetes.
Women: 11.5 million or 10.2% of all women aged 20 years or older have diabetes.
Non-Hispanic whites: 14.9 million, or 9.8% of all non-Hispanic whites aged 20 years or older have diabetes.
Non-Hispanic blacks: 3.7 million, or 14.7% of all non-Hispanic blacks aged 20 years or older have diabetes.
|
Estimated prevalence of diagnosed and undiagnosed diabetes in people aged 20 years or older, by age group, United States, 2007
Source: 2003–2006 National Health and Nutrition Examination Survey estimates of total prevalence (both diagnosed and undiagnosed) were projected to year 2007. Detailed information about this graph is available. |
Prevalence of diagnosed diabetes in people younger than 20 years of age, United States, 2007
About 186,300 people younger than 20 years have diabetes (type 1 or type 2). This represents 0.2% of all people in this age group. Estimates of undiagnosed diabetes are unavailable for this age group.
Race and ethnic differences in prevalence of diagnosed diabetes
Sufficient data are not available to derive prevalence estimates of both diagnosed and undiagnosed diabetes for all minority populations. For example, national survey data can not provide reliable estimates for the Native Hawaiian and other Pacific Islander population. However, national estimates of diagnosed diabetes for certain minority groups are available from national survey data and from the IHS user population database, which includes data for approximately 1.4 million American Indians and Alaska Natives in the United States who receive health care from the IHS. Because most minority populations are younger and tend to develop diabetes at earlier ages than the non-Hispanic white population, it is important to control for population age differences when making race and ethnic comparisons.
- Data from the 2005 IHS user population database indicate that 14.2% of the American Indians and Alaska Natives aged 20 years or older who received care from IHS had diagnosed diabetes. After adjusting for population age differences, 16.5% of the total adult population served by IHS had diagnosed diabetes, with rates varying by region from 6.0% among Alaska Native adults to 29.3% among American Indian adults in southern Arizona.
- After adjusting for population age differences, 2004–2006 national survey data for people aged 20 years or older indicate that 6.6% of non-Hispanic whites, 7.5% of Asian Americans, 10.4% of Hispanics, and 11.8% of non-Hispanic blacks had diagnosed diabetes. Among Hispanics, rates were 8.2% for Cubans, 11.9% for Mexican Americans, and 12.6% for Puerto Ricans
Incidence of diagnosed diabetes among people aged 20 years or older, United States, 2007
About 1.6 million new cases of diabetes were diagnosed in people aged 20 years or older in 2007.
|
Estimated number of new cases of diagnosed diabetes in people aged 20 years or older, by age group— United States, 2007
Source: 2004–2006 National Health Interview Survey estimates projected to year 2007. Detailed information about this graph is available. |
Incidence of diagnosed diabetes in people younger than 20 years of age, United States, 2002–2003
SEARCH for Diabetes in Youth is a multicenter study funded by CDC and NIH to examine diabetes (type 1 and type 2) among children and adolescents in the United States. SEARCH findings for the communities studied include the following:
- Based on 2002–2003 data, 15,000 youth in the United States were newly diagnosed with type 1 diabetes annually, and about 3,700 youth were newly diagnosed with type 2 diabetes annually.
- The rate of new cases among youth was 19.0 per 100,000 each year for type 1 diabetes and 5.3 per 100,000 for type 2 diabetes.
- Non-Hispanic white youth had the highest rate of new cases of type 1 diabetes.
- Type 2 diabetes was extremely rare among youth aged <10 years. While still infrequent, rates were greater among youth aged 10–19 years compared to younger children, with higher rates among U.S. minority populations compared with non-Hispanic whites.
- Among non-Hispanic white youth aged 10–19 years, the rate of new cases of type 1 diabetes was higher than for type 2 diabetes. For Asian/Pacific Islander and American Indian youth aged 10–19 years, the opposite was true—the rate of new cases of type 2 was greater than the rate for type 1 diabetes. Among African American and Hispanic youth aged 10–19 years, the rates of new cases of type 1 and type 2 diabetes were similar.
|
Rate of new cases of type 1 and type 2 diabetes among youth aged <20 years, by race/ethnicity, 2002–2003
Source: SEARCH for Diabetes in Youth
Study Detailed information about this graph is available. |
Deaths among people with diabetes, United States, 2006
- Diabetes was the seventh leading cause of death listed on U.S. death certificates in 2006. This ranking is based on the 72,507 death certificates in 2006 in which diabetes was listed as the underlying cause of death. According to death certificate reports, diabetes contributed to a total of 233,619 deaths in 2005, the latest year for which data on contributing causes of death are available.
- Diabetes is likely to be underreported as a cause of death. Studies have found that only about 35% to 40% of decedents with diabetes had it listed anywhere on the death certificate and only about 10% to 15% had it listed as the underlying cause of death.
- Overall, the risk for death among people with diabetes is about twice that of people without diabetes of similar age.
Complications of diabetes in the United States
Heart disease and stroke
- In 2004, heart disease was noted on 68% of diabetes-related death certificates among people aged 65 years or older.
- In 2004, stroke was noted on 16% of diabetes-related death certificates among people aged 65 years or older.
- Adults with diabetes have heart disease death rates about 2 to 4 times higher than adults without diabetes.
- The risk for stroke is 2 to 4 times higher among people with diabetes.
High blood pressure
- In 2003–2004, 75% of adults with self-reported diabetes had blood pressure greater than or equal to 130/80 millimeters of mercury (mm Hg), or used prescription medications for hypertension.
Blindness
- Diabetes is the leading cause of new cases of blindness among adults aged 20–74 years.
- Diabetic retinopathy causes 12,000 to 24,000 new cases of blindness each year.
Kidney disease
- Diabetes is the leading cause of kidney failure, accounting for 44% of new cases in 2005.
- In 2005, 46,739 people with diabetes began treatment for end-stage kidney disease in the United States and Puerto Rico.
- In 2005, a total of 178,689 people with end-stage kidney disease due to diabetes were living on chronic dialysis or with a kidney transplant in the United States and Puerto Rico.
Nervous system disease
- About 60% to 70% of people with diabetes have mild to severe forms of nervous system damage. The results of such damage include impaired sensation or pain in the feet or hands, slowed digestion of food in the stomach, carpal tunnel syndrome, erectile dysfunction, or other nerve problems.
- Almost 30% of people with diabetes aged 40 years or older have impaired sensation in the feet (i.e., at least one area that lacks feeling).
- Severe forms of diabetic nerve disease are a major contributing cause of lower-extremity amputations.
Amputations
- More than 60% of nontraumatic lower-limb amputations occur in people with diabetes.
- In 2004, about 71,000 nontraumatic lower-limb amputations were performed in people with diabetes.
Dental disease
- Periodontal (gum) disease is more common in people with diabetes. Among young adults, those with diabetes have about twice the risk of those without diabetes.
- Persons with poorly controlled diabetes (A1c > 9%) were nearly 3 times more likely to have severe periodontitis than those without diabetes.
- Almost one-third of people with diabetes have severe periodontal disease with loss of attachment of the gums to the teeth measuring 5 millimeters or more.
Complications of pregnancy
- Poorly controlled diabetes before conception and during the first trimester of pregnancy among women with type 1 diabetes can cause major birth defects in 5% to 10% of pregnancies and spontaneous abortions in 15% to 20% of pregnancies.
- Poorly controlled diabetes during the second and third trimesters of pregnancy can result in excessively large babies, posing a risk to both mother and child.
Other complications
- Uncontrolled diabetes often leads to biochemical imbalances that can cause acute life-threatening events, such as diabetic ketoacidosis and hyperosmolar (nonketotic) coma.
- People with diabetes are more susceptible to many other illnesses. Once they acquire these illnesses, they often have worse prognoses. For example, they are more likely to die with pneumonia or influenza than people who do not have diabetes.
- Persons with diabetes aged 60 years or older are 2–3 times more likely to report an inability to walk one-quarter of a mile, climb stairs, do housework, or use a mobility aid compared with persons without diabetes in the same age group.
Preventing diabetes complications
Diabetes can affect many parts of the body and can lead to serious complications such as blindness, kidney damage, and lower-limb amputations. Working together, people with diabetes, their support network, and their health care providers can reduce the occurrence of these and other diabetes complications by controlling the levels of blood glucose, blood pressure, and blood lipids, and by receiving other preventive care practices in a timely manner.
Glucose control
- Studies in the United States and abroad have found that improved glycemic control benefits people with either type 1 or type 2 diabetes. In general, every percentage point drop in A1c blood test results (e.g., from 8.0% to 7.0%) can reduce the risk of microvascular complications (eye, kidney, and nerve diseases) by 40%.
- In patients with type 1 diabetes, intensive insulin therapy has long-term beneficial effects on the risk of cardiovascular disease.
Blood pressure control
- Blood pressure control reduces the risk of cardiovascular disease (heart disease or stroke) among persons with diabetes by 33% to 50%, and the risk of microvascular complications (eye, kidney, and nerve diseases) by approximately 33%.
- In general, for every 10 mm Hg reduction in systolic blood pressure, the risk for any complication related to diabetes is reduced by 12%.
Control of blood lipids
- Improved control of LDL cholesterol can reduce cardiovascular complications by 20% to 50%.
Preventive care practices for eyes, feet, and kidneys
- Detecting and treating diabetic eye disease with laser therapy can reduce the development of severe vision loss by an estimated 50% to 60%.
- Comprehensive foot care programs can reduce amputation rates by 45% to 85%.
- Detecting and treating early diabetic kidney disease by lowering blood pressure can reduce the decline in kidney function by 30% to 70%. Treatment with angiotensin-converting enzyme (ACE) inhibitors and angiotensin receptor blockers (ARBs) are more effective in reducing the decline in kidney function than other blood pressure lowering drugs.
- In addition to lowering blood pressure, ARBs reduce proteinuria, a risk factor for developing kidney disease, by 35%, similar to the reduction achieved by ACE inhibitors.
Estimated diabetes costs in the United States in 2007
Total (direct and indirect): $174 billion
Direct medical costs: $116 billion
- After adjusting for population age and sex differences, average medical expenditures among people with diagnosed diabetes were 2.3 times higher than what expenditures would be in the absence of diabetes.
Indirect costs: $58 billion (disability, work loss, premature mortality)
Contact Us:
- CDC Diabetes Public Inquiries
- 800-CDC-INFO
(800-232-4636)
TTY: (888) 232-6348
8am-8pm ET
Monday-Friday
Closed Holidays - cdcinfo@cdc.gov
