March 6, 2012 (The Editor’s Desk is updated each business day.)
Characteristics of minimum wage workers in 2011
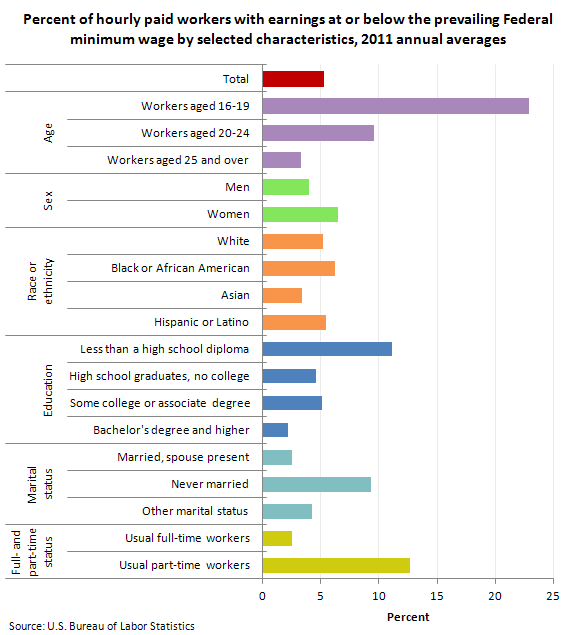
In 2011, 73.9 million American workers age 16 and over were paid hourly rates, representing 59.1 percent of all wage and salary workers. Of that number, 1.7 million earned exactly the prevailing Federal minimum wage of $7.25 per hour and 2.2 million had wages below the minimum. Together, these workers made up 5.2 percent of all hourly paid workers.
[Chart data]
Although workers under age 25 represented only about one-fifth of hourly paid workers, they made up about half of those paid the Federal minimum wage or less. Among employed teenagers paid by the hour, about 23 percent earned the minimum wage or less, compared with about 3 percent of workers aged 25 and over.
About 6 percent of women paid hourly rates had wages at or below the prevailing Federal minimum, compared with about 4 percent of men. About 5 percent of White hourly paid workers earned the Federal minimum wage or less, compared with about 6 percent of Blacks and about 3 percent of Asians.
Among hourly paid workers age 16 and over, about 11 percent of those who had less than a high school diploma earned the Federal minimum wage or less, compared with about 5 percent of those who had a high school diploma (with no college) and about 2 percent of college graduates. Among hourly paid workers of Hispanic origin, 5 percent earned the minimum wage or less.
Never-married workers, who tend to be young, were more likely than married workers to earn the Federal minimum wage or less (about 9 percent versus about 2 percent).
Part-time workers (persons who usually work fewer than 35 hours per week) were more likely than full-time workers to be paid the Federal minimum wage or less (about 13 percent versus about 2 percent).
The proportion of hourly paid workers earning the prevailing Federal minimum wage or less declined from 6.0 percent in 2010 to 5.2 percent in 2011. This remains well below the figure of 13.4 percent in 1979, when data were first collected on a regular basis.
These data on minimum wage earners are derived from the Current Population Survey, a monthly nationwide sample survey of households. Data in this summary are 2011 annual averages.The presence of a sizable number of workers with wages below the Federal minimum does not necessarily indicate violations of the Fair Labor Standards Act, as there are exemptions to the minimum wage provisions of the law. To learn more, see "Characteristics of Minimum Wage Workers: 2011."
Related TED articles
Earnings and Wages |
Labor Force |
Men |
Women |
Youth
Of interest
Spotlight on Statistics: National Hispanic Heritage Month
In this Spotlight, we take a look at the Hispanic labor force—including labor force participation, employment and unemployment, educational attainment, geographic location, country of birth, earnings, consumer expenditures, time use, workplace injuries, and employment projections.
Read more »