August 04, 2005 (The Editor’s Desk is updated each business day.)
Alternative employment arrangements and worker preferences
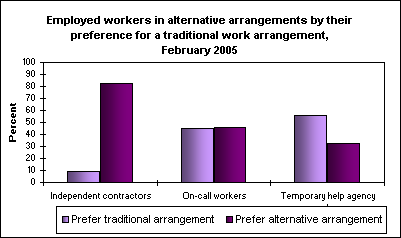
In February 2005, there were 10.3 million independent contractors, 2.5 million on-call workers, and 1.2 million temporary help agency workers.
[Chart data—TXT]
These types of workers are considered to have alternative employment arrangements, in contrast to traditional arrangements.
The majority of independent contractors (82 percent) preferred their work arrangement to a traditional job, while only 32 percent of temporary help agency workers preferred their current arrangement. Among on-call workers, 46 percent preferred their current arrangement while 45 percent would prefer a traditional job.
These data are from a supplement to the February 2005 Current Population
Survey. The percentages on the chart for each group do not sum to 100, because in some cases the worker response was "It depends" and in other cases a response was not available. To find out more, see
Contingent and Alternative Employment Arrangements, February
2005, news release USDL 05-1433.
Related TED articles:
Of interest
Spotlight on Statistics: National Hispanic Heritage Month
In this Spotlight, we take a look at the Hispanic labor force—including labor force participation, employment and unemployment, educational attainment, geographic location, country of birth, earnings, consumer expenditures, time use, workplace injuries, and employment projections.
.
Read more »