July 30, 2010 (The Editor’s Desk is updated each business day.)
Over-the-year employment changes in large metro areas, June 2010
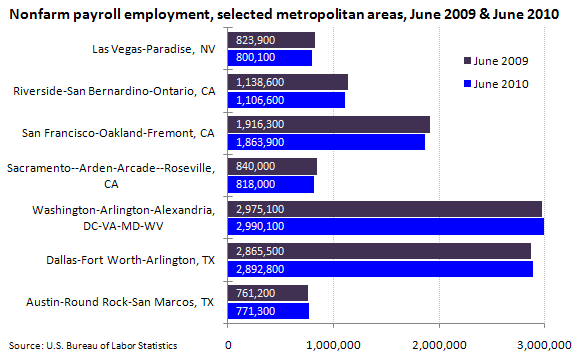
The largest over-the-year percentage decreases in employment among large metropolitan areas (metropolitan areas with annual average employment levels above 750,000 in 2009) was posted in Las Vegas-Paradise, Nevada (‑2.9 percent), followed by three metropolitan areas in California: Riverside-San Bernardino-Ontario (‑2.8 percent), San Francisco-Oakland-Fremont (‑2.7 percent), and Sacramento--Arden-Arcade--Roseville (‑2.6 percent).
[Chart data]
The large metropolitan area that reported the biggest over-the-year percentage increase in employment was Austin-Round Rock-San Marcos, Texas (+1.3 percent), followed by Dallas-Fort Worth-Arlington, Texas (+1.0 percent), and Washington-Arlington-Alexandria, D.C.-VA-MD-WV (+0.5 percent).
Over-the-year, nonfarm employment decreased in 28 of the 36 large metropolitan areas.
These data are from the Current Employment Statistics (State and Metro Area) program. The most recent month's employment data are preliminary and subject to revision. To learn more, see "Metropolitan Area Employment and Unemployment — June 2010" (HTML) (PDF), news release USDL-10-1046. The most recent month's employment data are preliminary and subject to revision.
Related TED articles
Employment |
Metropolitan areas and counties
Of interest
Spotlight on Statistics: National Hispanic Heritage Month
In this Spotlight, we take a look at the Hispanic labor force—including labor force participation, employment and unemployment, educational attainment, geographic location, country of birth, earnings, consumer expenditures, time use, workplace injuries, and employment projections.
.
Read more »