September 03, 2010 (The Editor’s Desk is updated each business day.)
Youth employment and unemployment in July 2010
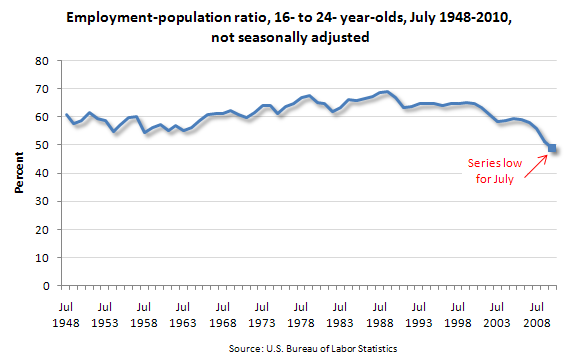
In July, the employment-population ratio for youth—the proportion of the 16- to 24-year-old civilian noninstitutional population that was employed—was 48.9 percent. This was the lowest July rate on record for the series, which began in 1948. (The month of July typically is the summertime peak in youth employment.)
[Chart data]
In July, the employment-population for youth was down 2.5 percent from July 2009 and has dropped by about 20 percentage points since its peak in July 1989.
The employment-population ratio for young men was 49.9 percent in July, down from 52.2 percent in July 2009. The employment-population ratios for women (48.0 percent), whites (53.0 percent), and Hispanics (43.6 percent) in July 2010 also were substantially lower than a year earlier.
[Chart data]
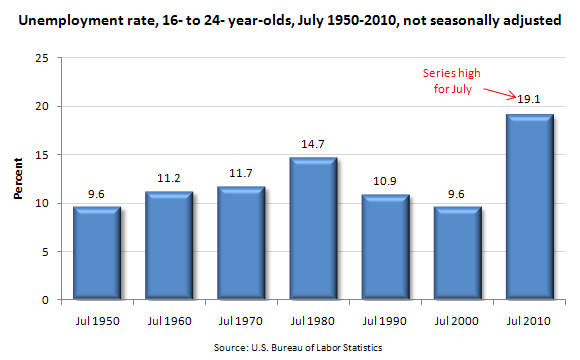
The youth unemployment rate edged up over the year to 19.1 percent in July—the highest July rate on record for the series, which also began in 1948.
Among major demographic groups, the unemployment rates for young men (20.5 percent), blacks (33.4 percent), and Asians (21.6 percent) continued to trend up from a year earlier; the jobless rates for young women (17.5 percent), whites (16.2 percent), and Hispanics (22.1 percent) were virtually unchanged.
These data are from the Current Population Survey. The data are not seasonally adjusted. To learn more about youth employment and unemployment, see "Employment and Unemployment Among Youth—Summer 2010" (HTML) (PDF), news release USDL 10-1175.
Employment |
Men |
Unemployment |
Women |
Youth
Of interest
Spotlight on Statistics: National Hispanic Heritage Month
In this Spotlight, we take a look at the Hispanic labor force—including labor force participation, employment and unemployment, educational attainment, geographic location, country of birth, earnings, consumer expenditures, time use, workplace injuries, and employment projections.
Read more »