August 5, 2011 (The Editor’s Desk is updated each business day.)
Metropolitan area employment in June 2011
In June, 217 metropolitan areas reported over-the-year increases in nonfarm payroll employment, 143 reported decreases, and 12 had no change.
[Chart data]
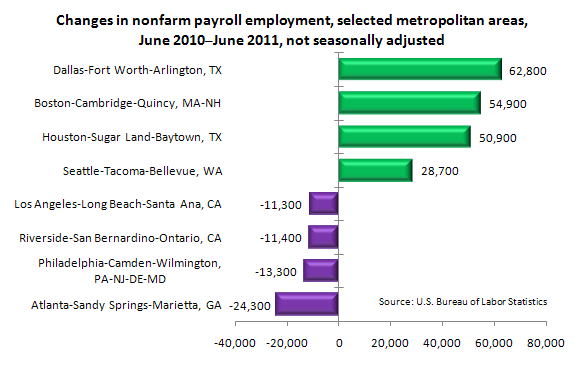
The largest over-the-year employment increase occurred in Dallas-Fort Worth-Arlington, Texas (+62,800), followed by Boston-Cambridge-Quincy, Massachusetts-New Hampshire (+54,900), Houston-Sugar Land-Baytown, Texas (+50,900), and Seattle-Tacoma-Bellevue, Washington (+28,700).
The largest over-the-year decreases in employment occurred in Atlanta-Sandy Springs-Marietta, Georgia (−24,300), Philadelphia-Camden-Wilmington, Pennsylvania-New Jersey-Delaware-Maryland (−13,300), Riverside-San Bernardino-Ontario, California (−11,400), and Los Angeles-Long Beach-Santa Ana, California (−11,300).
Nonfarm employment rose in 24 of the 36 metropolitan areas with annual average employment levels above 750,000 between June 2010 and June 2011.
These data are from the Current Employment Statistics (State and Metropolitan Area) program. For more information, see "Metropolitan Area Employment and Unemployment — June 2011" (HTML) (PDF), news release USDL-11-1150.
Related TED articles
Employment |
Metropolitan areas and counties
Of interest
Spotlight on Statistics: National Hispanic Heritage Month
In this Spotlight, we take a look at the Hispanic labor force—including labor force participation, employment and unemployment, educational attainment, geographic location, country of birth, earnings, consumer expenditures, time use, workplace injuries, and employment projections.
.
Read more »