April 14, 2010 (The Editor’s Desk is updated each business day.)
Import and export prices increase in March 2010
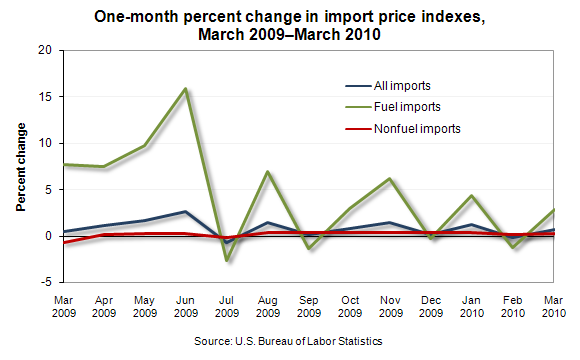
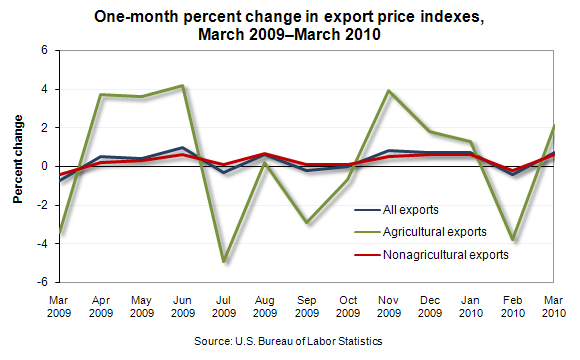
Both the U.S. Import and Export Price Indexes rose 0.7 percent in March. The increase in the Import Price Index was attributable to higher prices for both fuel and nonfuel imports, while the increase in the Export Price Index was due to the increase in the price of nonagricultural exports.
[Chart data]
In March, import prices increased for the seventh time in the past eight months. The March upturn followed a 0.2-percent decline in February and was largely driven by a turnaround in fuel prices, which accounted for approximately 80 percent of the increase.
Import fuel prices resumed an upward trend in March, rising 2.9 percent following a 1.2-percent drop in February. A 4.0-percent increase in petroleum prices was slightly offset by a 12.4-percent decline in natural gas prices, which decreased for the first time in six months.
Prices for nonfuel imports rose for the eighth consecutive month, advancing 0.2 percent. The increase was led by higher prices for nonfuel industrial supplies and materials, consumer goods, and foods, feeds, and beverages. Lower prices for capital goods and automotive vehicles partly offset the overall advance.
Export prices increased for the fourth time in the past five months, rising 0.7 percent in March after declining 0.4 percent the previous month. Higher nonagricultural prices accounted for approximately 75 percent of the overall increase.
[Chart data]
The price index for agricultural exports rose 2.1 percent in March, following a 3.8-percent decline in February. Higher prices for cotton, soybeans, corn, meat, and wheat all contributed to the upturn in agricultural prices.
Nonagricultural prices resumed an upward trend in March following a 0.2-percent downturn in February, increasing 0.6 percent. Higher prices for nonagricultural industrial supplies and materials and capital goods contributed to the overall increase.
These data are from the BLS International Price program. Import and export price data are subject to revision. For more information, see "U.S. Import and Export Price Indexes — March 2010" (HTML) (PDF), news release USDL-10-0465.
Related TED articles
International comparisons |
Prices
Of interest
Spotlight on Statistics: National Hispanic Heritage Month
In this Spotlight, we take a look at the Hispanic labor force—including labor force participation, employment and unemployment, educational attainment, geographic location, country of birth, earnings, consumer expenditures, time use, workplace injuries, and employment projections.
.
Read more »