February 17, 2000 (The Editor’s Desk is updated each business day.)
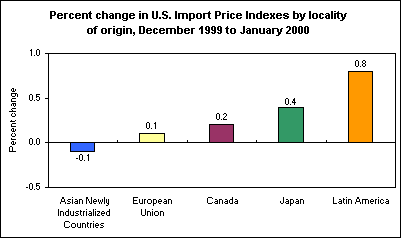
Rises in import prices by locality of origin in January
The price index for imports from Japan rose for
the sixth consecutive month, up 0.4 percent in January after gaining the
same amount in December. Over the past 12 months, the index increased 1.8
percent.

[Chart data—TXT]
Prices of imports from Canada continued to increase, up 0.2 percent in
January and 7.1 percent over the January 1999-2000 period. Led primarily
by ongoing price increases for petroleum products, the import price index
for Latin America also rose in January, up 0.8 percent. Over the past 12
months, the index gained 17.8 percent.
In addition, prices of imports from the European Union edged up 0.1
percent in January, after recording no change, on average, in December.
Prices of manufactured goods have declined 0.5 percent over the past two
months due to the rising value of the U.S. dollar against the European
currencies; however, overall prices of European imports have remained
largely unchanged because of a 12.9 percent increase for the price index
of nonmanufactured goods over the same time period.
The index for imports from the Asian Newly Industrialized Countries
dipped 0.1 percent last month, after posting no change in December and a
0.4 percent decline in November. For the year ended in January, the index
fell 0.8 percent.
These data are a product of the BLS International
Price program. Find out more in "U.S.
Import and Export Price Indexes - January
2000," news release USDL
00-45. The Asian Newly Industrialized Countries include Hong Kong,
Singapore, South Korea, and Taiwan. Latin America includes Mexico, Central
America, South America, and the Caribbean. Note: import price data are
subject to revision in each of the three months after original
publication.
Of interest
Spotlight on Statistics: National Hispanic Heritage Month
In this Spotlight, we take a look at the Hispanic labor force—including labor force participation, employment and unemployment, educational attainment, geographic location, country of birth, earnings, consumer expenditures, time use, workplace injuries, and employment projections.
.
Read more »
