|
October 2011
Automobiles

The U.S. automobile industry can be viewed as both a barometer and beneficiary of American growth and economic achievement. Supporting that view is the fact that the automobile industry affects industries that manufacture steel, glass, plastics, and rubber, as well as those that refine and sell gasoline, build roads, and maintain, repair, and sell motor vehicles.
Motor vehicles also affect our daily lives. In 2010, on an average day, 67.6 percent of the civilian noninstitutional population aged 15 and over drove; those who drove spent on average 1 hour and 18 minutes driving. (Source: ATUS)
The structure of the U.S. automobile industry has changed. Several domestic automakers have lost market share to foreign-owned manufacturers, which now manufacture and sell an increasing number of cars in the United States and throughout North America.
In this Spotlight we present BLS data to provide insight into employment within the motor vehicle and parts manufacturing industry, motor vehicle-related expenditures on the part of U.S. households, injuries experienced by those who work on motor vehicles, and industry productivity.
The Price of Automobiles
Price is an important consideration to consumers when they begin the search for a new, used, or leased automobile. Since mid-2008, the prices of new, used, and leased cars and trucks have been more volatile than in previous years. The price of leased cars and trucks increased from October 2007 to November 2009, while the price of used cars and trucks declined from June 2008 to September 2009. In contrast, the price of leased cars and trucks declined from January 2010 to September 2011 while the price of used cars and trucks increased from October 2009 to September 2011. In comparison to prices of used and leased cars and trucks, prices of new cars and trucks have typically increased and decreased at smaller rates since 2003.
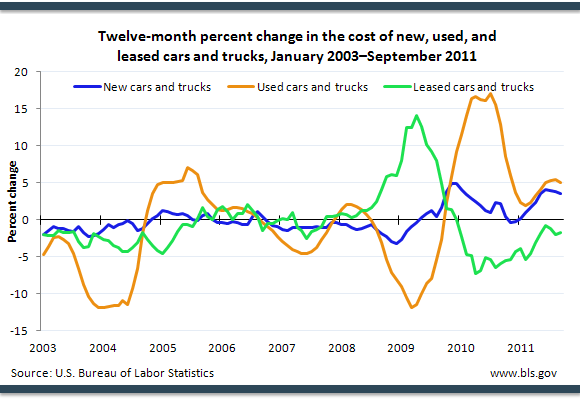
Source: Consumer Price Index | Chart Data
What We Spend on Vehicle Expenses
Household expenditures associated with maintaining and operating a vehicle vary by region. In 2010, households in the Northeast region of the United States spent, on average, more on vehicle insurance than the amount spent by households residing in other regions. Compared to households residing in other U.S. regions, households in the Northeast region spent, on average, less on vehicle finance charges and gasoline and motor oil, while households in the South region spent the most on those same items.
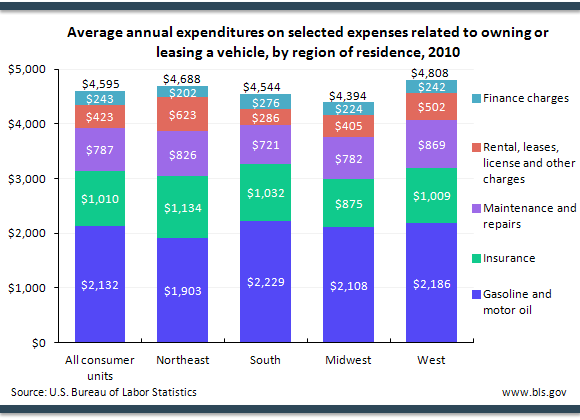
Source: Consumer Expenditure Survey | Chart Data
Employment and Hours of Production Workers
Employment of workers in the motor vehicle and parts manufacturing industry steadily decreased from mid-2006 until mid-2009. Average weekly hours of production workers fell from 43.0 in February 2008 to 37.4 in May 2009. Since mid-2009 employment has slowly increased, while average weekly hours among production workers sharply increased until late 2009 and has fluctuated since then.
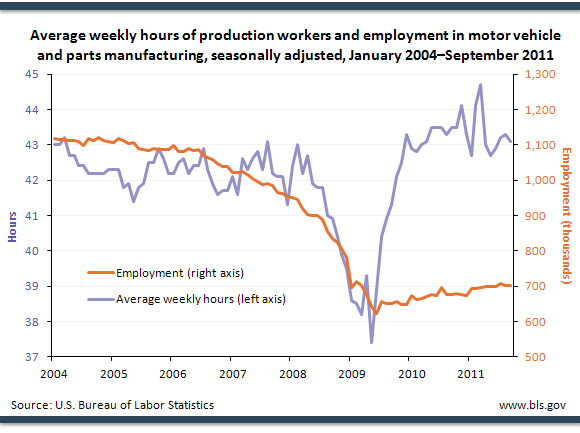
Source: Current Employment Statistics | Chart Data
State Employment
In 2010, more than half of total employment in the motor vehicle manufacturing industry was located in Michigan, Ohio, and Indiana.
Since 1990 (the start of the data series), among all states, Michigan has had the highest employment in the motor vehicle manufacturing industry. Michigan’s employment in this industry has decreased from 102,000 jobs in 1990 to 34,900 in 2010—a loss of 67,100 jobs.
Among all states, Alabama experienced the largest increase in employment within the motor vehicle manufacturing industry—from 400 jobs in 1990 to 10,200 in 2010.
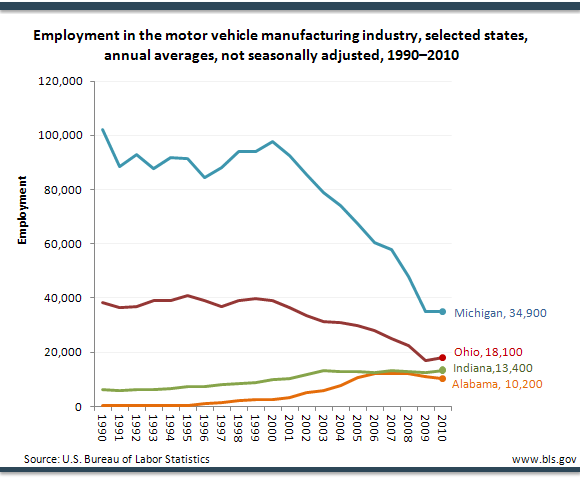
Source: Current Employment Statistics | Chart Data
Where are Motor Vehicle Parts Made?
The largest sector of the motor vehicle and parts manufacturing industry is the motor vehicle parts manufacturing industry. The establishments in this industry manufacture electrical and electronic equipment; engines and transmissions; brake systems; seating and interior trim; steering and suspension components; air-conditioners; and motor vehicle stampings, such as fenders, tops, body parts, trim, and molding.
In 2010, there were 5,784 private business establishments in this industry, employing 415,180 workers. Michigan led the nation, with 829 private business establishments and 84,452 employees.
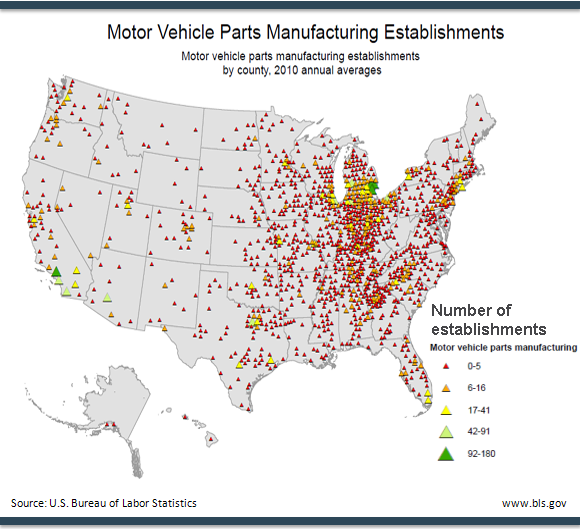
Source: Quarterly Census of Employment and Wages | Chart Data
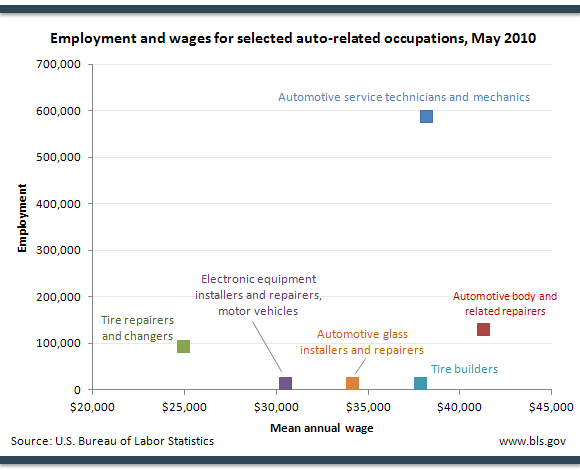
Can You Help Repair My Automobile?
Whether you have a flat tire, need a part replaced, or schedule routine maintenance work, workers in a variety of auto-related occupations help repair or maintain your vehicle.
About 588,000 automotive service technicians and mechanics work in the United States. Their responsibilities range from making basic mechanical repairs, requiring skills with traditional hand tools, to high-level technology-related work, requiring workers who can use computerized shop equipment and work with electronic components.
In many auto shops, workers install and repair tires, automobile bodies, electronic equipment, and glass. Average annual wages for these workers fall near and below the average for all occupations ($44,110).
Source: Occupational Employment Statistics | Chart Data
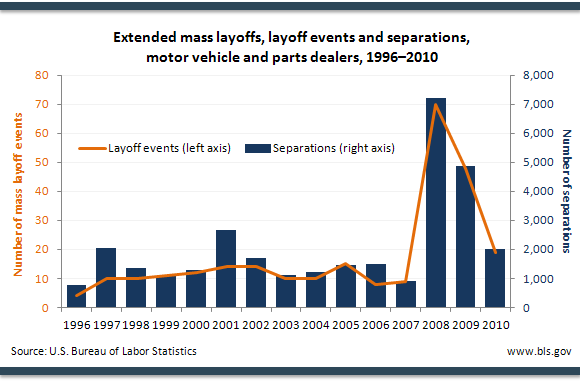
Layoffs at Motor Vehicle and Parts Dealers
Extended mass layoffs are layoffs of at least 31 days in duration that involve 50 or more individuals from a single establishment filing initial claims for unemployment insurance during a consecutive 5-week period. The reasons for such layoffs may include a change in business ownership, a reduction in business demand due to excess inventory and competition (domestic and foreign), and corporate reorganization and restructuring.
In 2008, during the recent recession that started in December 2007, employers in the motor vehicles and parts dealers industry initiated a total of 70 mass layoff events (a series high) that resulted in the separation, or displacement, of 7,224 workers from their jobs. From 2008–2010, there were a total of 137 extended mass layoff events in this industry—ten more than the total of 127 experienced from 1996–2007.
Source: Mass Layoff Statistics | Chart Data
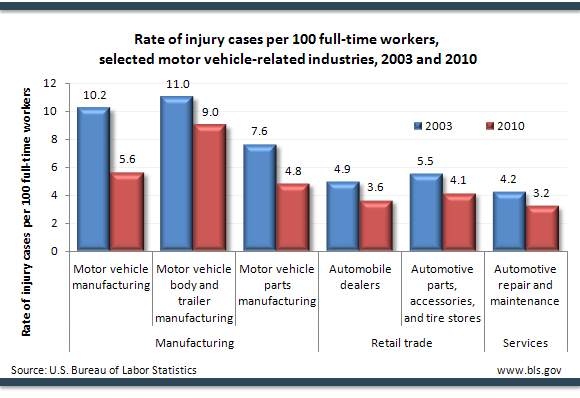
Motor Vehicles and Workplace Injuries
Whether the industry involves manufacturing motor vehicles or selling or repairing automobiles, workplace safety is critical to minimizing work-related injuries. Within the motor vehicle manufacturing industry, injury cases decreased from a rate of 10.2 per 100 full-time workers in 2003 to a rate of 5.6 per 100 full-time workers in 2010. In 2010, injury cases in the motor vehicle parts manufacturing industry occurred at a rate of 4.8 per 100 full-time workers, compared to a rate of 7.6 per 100 full-time workers in 2003.
Source: Injuries, Illnesses, Fatalities | Chart Data
Types of Injuries
Workers in the automobile and light duty motor vehicle manufacturing industry experience higher rates of injury and illness than do workers in most other industries. Heat, fumes, noise, and repetition are not uncommon in this industry. In 2009, nonfatal repetitive motion injuries involving days away from work were more than triple the rate of injuries resulting from being struck by an object—which occurred at a rate of 9.2 per 10,000 full-time workers in 2009. Many workers come into contact with oil and grease and may have to lift and fit heavy objects. Injuries from overexertion and lifting occurred at a rate of 11.1 per 10,000 full-time workers in 2009, nearly twice the rate of injuries resulting from slips or trips and caught in an object.
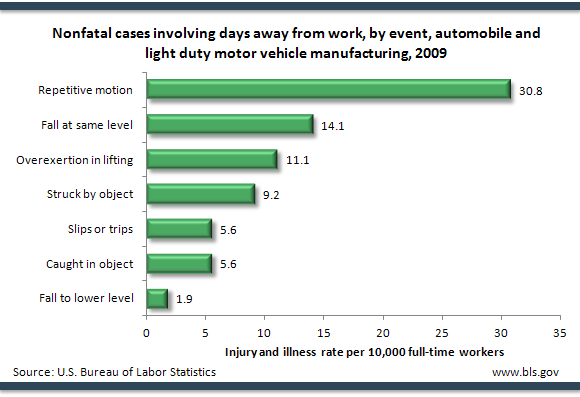
Source: Injuries, Illnesses, Fatalities | Chart Data
Labor Productivity in Motor Vehicle Manufacturing
Motor vehicle manufacturers use a combination of labor, capital, and intermediate inputs to produce output. For example, workers (labor) use tools, equipment, and an assembly line (capital), along with energy, raw materials, components, and purchased services (intermediate inputs) to create automobiles (output).
Labor productivity—defined as output per hour—increased in the motor vehicle manufacturing industry from 2000 to 2007, but declined from 2007 to 2009.
From 2000 to 2007, labor productivity rose at an average annual compound rate of 6.4 percent per year, due to an average increase in output of 1.7 percent per year and a decline in hours of 4.4 percent per year. From 2007 to 2009, labor productivity fell, on average, 7.4 percent per year, as output declined an average of 25.7 percent and the number of labor hours fell an average of 19.8 percent per year.
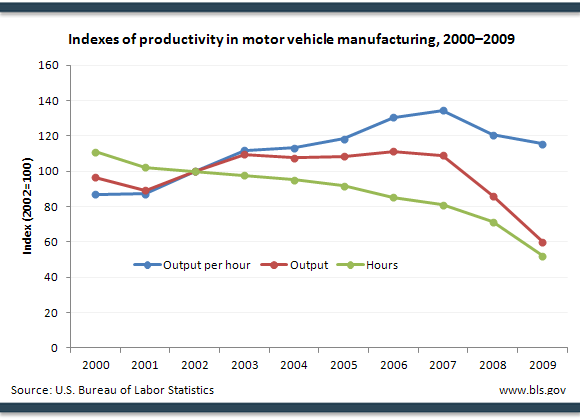
Source: Productivity and Costs by Industry | Chart Data
More BLS Data
Data for this Spotlight were derived from the Current Employment Statistics program, the Consumer Price Index program, the American Time Use Survey, the Consumer Expenditure Survey, the Quarterly Census of Employment and Wages, the Injuries, Illnesses and Fatalities program, the Occupational Employment Statistics program, the Mass Layoffs Statistics program, and the Industry Productivity program.
For further information, please see the articles indexed under Auto Industry in the archives of the Monthly Labor Review, as well as the Automobile Industry articles featured on The Editor's Desk. Also of interest, "Careers in Electric Vehicles" by James Hamilton, part of a BLS series of Green Career Information articles.
Note: Data in text, charts, and tables are the latest available at the time of publication. Internet links may lead to more recent data.
General Information: (202) 691-5200
Media Contact: (202) 691-5902
|