|
July 2011
School's Out
 "Out for summer
Out till fall
We might not be back at all"
After "School's Out" became Alice Cooper's first hit, he said "What's the greatest three minutes of your life? One is the last three minutes of the last day of school, when you're sitting there and it's like a slow fuse burning."
So what do millions of youth age 16-24 do once that "slow fuse" is no longer burning and school really is out for the summer? Some, like the young lady holding the placard in the photo, are "ready to work" and even have jobs waiting for them. Others may be ready to work, but will have to find a job. Still others, perhaps believing there is no job out there for them, return to school or just relax. In this Spotlight we take a look at the number of young people over the past 60 years, the proportion of youth who are working, the industries in which they work, the unemployment rate among youth, and the proportion who are in school in the summer. Also, we look at industries that have highly seasonal employment patterns in the summer.
How Many Young Adults are we Talking About?
The number of 16-24 year olds in the population—an age group that includes young people at various stages of life including high school students, college students, college graduates, and those who never went to college—has ebbed and flowed considerably in the post World War II era. Note the rapid increase in the youth population during the late 1970s, as the baby boom generation—those born between 1946 and 1964—moved into the 16-to-24 year age range. This was followed by a moderate decline during the 1980s as the smaller generation X, or the baby bust generation (born between 1965 and 1975) reached age 16. In the 1990s the youth population once again turned upward as members of the echo-boom generation—those born between 1976 and 2001—turned 16. In 2011, there were nearly 17 million youth 16 to 19 years of age, and about 38 million youth 16 to 24, in the United States.

Source: Current Population Survey | Chart Data
What Proportion of Youth are Working?
The employment-population ratio answers the question, "What proportion of the population is employed?" As you can see in the chart below, the employment-population ratio for youth has been in a rather steep decline since the beginning of the 1990s. As of July 2010, the employment-population ratios were at historic lows of 31.3 percent for ages 16-19 and 48.9 percent for ages 16-24.

Source: Current Population Survey | Chart Data
Summer School Attendance
The declining employment-population ratio has been accompanied by a growing number of youth attending summer school. In fact, the percentage of youth attending summer school recently set record highs: 45.6 percent for 16 to 19 year olds, 34.9 percent for 16 to 24 year olds, and 26.3 percent for 20 to 24 year olds. Although work and school are not exclusive, youth enrolled in school are less likely to be working than their non-enrolled peers. This movement of youth from the workplace to the classroom is no doubt related to some combination of the weakening economy, realization of the tremendous potential earning power of higher levels of education, and other factors unique to individual young persons.

Source: Current Population Survey | Chart Data
Youth Unemployment
The unemployment rate for young men was consistently higher than that for young women between July 2007 and July 2010.
During this period, employment in industries that generally hire more men than women (such as construction and manufacturing) has declined more than employment in industries that tend to employ more women than men (such as education and health care). Unemployment among white youths tended to be below that of black and Hispanic youth, as has been typical of their older counterparts. Unemployment among all youth groups was up markedly between 2007 and 2010.

Source: Current Population Survey | Chart Data
Where do Youth Work in the Summer?
The youth labor force grows sharply between April and July each year, when large numbers of high school and college students take or search for summer jobs and graduates enter the labor market in search of permanent employment. For those youth who intend to return to school in the fall, temporary summer jobs—often found in the accommodation and food services industries and retail trade—are a good fit. Overall, roughly equal numbers of young men and young women are employed during the summer. Young women outnumber young men in the education and health services industry; in the manufacturing and construction industries, there are more young men than young women.

Source: Current Population Survey | Chart Data
Which Industries Hire During the Summer?
Hiring in many industries is seasonal. It follows a regular pattern of peaks and valleys year after year. In some industries maximum employment occurs during the summer and minimum employment in the winter; for others, the reverse is true.
The chart below shows the seasonal changes in employment in selected private sector industries between January 2001 and April 2011. Keep in mind that the y axis is in logarithmic scale. So, even though employment peaks and valleys are greater in percentage terms in the recreational and vacation camps industry than in the hotels and motels, except casino hotels, industry in numerical terms they are not. In 2010, for example, employment in recreational and vacation camps varied from a low of 15,100 in January to a high of 66,500 in July (a range of 51,400), while employment in the hotels and motels, except casino hotels, varied from a low of 1,335,100 in January to a high of 1,504,100 (a range of 169,000).
NOTE: Because the employment data in these two charts cover a large range of values, the data are plotted on logarithmic scales that show the detail of the employment fluctuations in the smaller industries as clearly as the employment fluctuations in the larger industries.

Source: Current Employment Statistics | Chart Data
And Which Industries Show Declining Employment During the Summer?
Employment in education services is also very seasonal—employment in education services industries is typically at its lowest level during the summer months. In 2010, employment in local government education was well above 8 million during most of the months of the traditional school year, but was below 7 million in July and August. Employment in state government education exhibited a similar pattern, with employment levels around 2.4 to 2.5 million for most of the school year, but close to 2.0 million during the summer months. Private elementary and secondary schools and colleges and universities also employed the smallest number of workers duing the summer. Another education services industry that has a similar seasonal employment pattern is child day care services (not shown on the chart), which typically reaches its annual minimum employment level in July.
NOTE: Local government education primarily consists of employment in publicly owned preschools, elementary, and secondary schools. State government education primarily consists of employment in publicly owned postsecondary schools (colleges and universities).

Source: Current Employment Statistics | Chart Data
What Are the Most Hazardous Occupations for Young People?
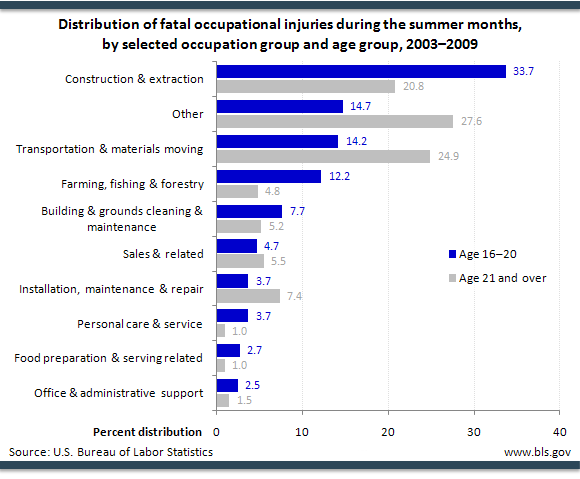
The summer months provide many young people opportunities to earn and learn, but in certain occupations, summer jobs can result in injury and sometimes even death. From 2003 to 2009, a total of 401 workers between the ages of 16 and 20 were fatally injured on the job during the summer months. This comprises about a third of the 1,239 fatal injuries in this age group for all months during this 7-year period.
Of the fatalities involving younger workers during summer employment, about a third occurred in construction and extraction occupations. This occupation group accounted for a considerably higher percentage of fatal injuries for 16 to 20-year-olds than for workers aged 21 and over in the summer months. The occupations accounting for the second and third largest shares of 16-20 year old worker fatalities during summer months were transportation and materials-moving occupations (14 percent) and farming, forestry and fishing occupations (12 percent).
Source: Injuries, Illnesses, and Fatalities program | Chart Data
More BLS Data
Data for this Spotlight were derived from the Current Population Survey, the Current Employment Statistics, program and the Census of Fatal Occupational Injuries.
For further information, please see The early 2000s: a period of declining teen summer employment rates, and the articles indexed under Youth in the archives of the Monthly Labor Review, as well as the Youth articles featured on The Editor's Desk.
Note: Data in text, charts, and tables are the latest available at the time of publication. Internet links may lead to more recent data.
General Information: (202) 691-5200
Media Contact: (202) 691-5902
|