|
March 2011
Women at Work
 Until things slowly changed during the last century, women's participation in the labor force was limited by traditional cultural, educational, and legal practices. Women's work outside of home and marriage was restricted to a handful of occupations such as domestic service, factory work, farm work, and teaching. Over the past several decades, the women's labor force in the United States and throughout the world has experienced many changes. Women's labor force participation rates are significantly higher today than they were in the 1970s. Throughout that period, women have increasingly attained higher levels of education and experienced an increase in their earnings as a proportion of men's earnings. In addition to highlighting the past, present, and future of women in the workforce, this Spotlight presents BLS data on the types of activities that women spend their time doing during an average week, how they choose to spend their hard-earned money, and the nature of fatal injuries in the workplace.
How Women Spend their Time
On average, including women who were employed and those who were not employed, young women (between the ages of 15 to 19) spent less time doing household activities than did women in other age groups. Women aged 65 and over spent more time participating in leisure activities than did women in the younger age groups. On average, among women aged 25 and over, those with a bachelor's degree or more education spent more time working than they did doing household activities, while women with less than a high school education spent more time doing household activities than they did working.
NOTE: These estimates are averages across women who were employed and those who were not employed. Some of the variation appearing in the chart is due to these differences.

Source: American Time Use Survey | Chart Data
Average Annual Expenditures by Single Women
In 2008–09, single women spent, on average, 25.4 percent of their annual expenditures on shelter. Those women earning an annual pretax income of less than $5,000—which represented the lowest income group—spent , on average, a higher proportional amount (49.3 percent of total spending) on food, shelter, and apparel and services than women in all other income groups. Women in the highest income group—those earning an annual pretax income greater than or equal to $40,000—spent, on average, a higher amount per person on transportation, entertainment, and apparel and services than women in the lowest three income groups combined.

Source: Consumer Expenditure Survey | Chart Data
Educational Attainment of Young Women
In the October when they were 23 years old, 23.4 percent of young women held a bachelor's degree (or higher), compared with 14.3 percent of young men. Overall, young women were more likely to have graduated from high school and to have attended college. Once enrolled in college, women were less likely than men to leave college between school years without graduating.

Source: National Longitudinal Surveys | Chart Data
Fatal Occupational Injuries
In 2009, a total of 319 fatal work injuries involved women, compared with a total of 4,021 for men. Transportation incidents—including incidents on highways and nonhighways, as well as those involving air, rail, and water transportation—caused the highest percentage of fatal work injuries to women (43 percent), compared with 38 percent for men. The second highest percentage of fatal occupational injuries to women, 30 percent, resulted from assaults and violent acts—including violence by other persons, self-inflicted injuries, and attacks by animals. Compared with men, a lower percentage of fatal work injuries to women resulted from contact with objects and equipment, falls, and exposure to harmful substances and environments.

Source: Injuries, Illnesses and Fatalities | Chart Data
Ratio of Women's to Men's Earnings by Occupation
The ratio of women's to men's earnings, for all occupations, was 81.2 percent in 2010. The ratio varies by occupation. In occupations such as personal financial advisors, retail salespersons, insurance sales agents, and lawyers, for example, the earnings ratios are lower than the overall ratio of women’s to men’s earnings. In occupations such as stock clerks and order fillers, bill and account collectors, and combined food preparation and serving workers, women earn more than men.

Source: Current Population Survey | Chart Data
Women's Earnings and Employment by Occupation
The number of women employed, and the wages they earn, vary by occupation. In 2009, the 903,000 women employed as cashiers earned, at the median, $361 per week, while the 92,000 women working as pharmacists had median weekly earnings of $1,475. Nearly 2 million women worked as elementary and middle school teachers, and a similar number worked as registered nurses; the median weekly earnings for women in these two occupations were $891 and $1,035, respectively. (Median wages are the midpoint of an arrangement of earnings from lowest to highest; in any given group, half the workers earn less—and half earn more—than the median wage.)

Source: Current Population Survey | Chart Data
Employment by Industry
In 1964, about 19 million of the nation's nonfarm employees were women; the three industries that employed the most women—manufacturing; trade, transportation, and utilities; and local government—accounted for 54 percent of these women. By 2010, nearly 65 million women had jobs, and 53 percent of these women worked in the three industries that employed the most women: education and health services; trade, transportation, and utilities; and local government. During this period, the growth of the education and health industry, and the number of women employed in it, has been notable.
In the 1960s, more women were employed in manufacturing than in any other industry. During the 1970s, and 80s, more women were employed in trade, transportation, and utilities than any other industry. Until 1975, there were more women employed in local government than in education and health services. In 1976, employment of women in education and health exceeded that in local government. From 1993 to 2010, education and health services has ranked first in employment of women, followed by trade, transportation and utilities, and local government.
NOTE: Education and health services includes privately owned schools. Most publicly owned schools are included in local government.

Source: Current Employment Statistics | Chart Data
Labor Force Participation Rates by Country
In 2009, 59 percent of working-age women in the United States were in the labor force. This percentage has increased from 43 percent four decades ago. The labor force participation rate has increased during this period in all of the countries studied by the BLS, except Japan. In 2009, only a few countries, notably Canada and Sweden, had labor force participation rates for women that were higher than the U.S. rate.
NOTE: Participation rates begin in 1971 for the United Kingdom and 1973 for the Netherlands.

Source: International Labor Comparisons | Chart Data
Labor Force by Educational Attainment
In 1970, 22.1 percent of women in the civilian labor force had either attended some college or graduated with a degree. By 2010, that figure had increased over three-fold to 66.7 percent of women in the labor force. The percentage of women in the civilian labor force that had less than a high school diploma decreased from 33.5 percent in 1970 to 6.8 percent in 2010.
NOTES:
1. Due to rounding, the sum of percent distributions does not equal 100.
2. For data in 1970, educational attainment categories are based on the number of years of school completed (i.e. less than 4 years of high school, 4 years of high school and no college, 1 to 3 years of college, and 4 years or more of college).

Source: Current Population Survey | Chart Data
Labor Force Projections
From 2008 to 2018, the women's civilian labor force is projected to increase by 9.0 percent, or 6,462,000.
The number of women aged 65 to 74 in the civilian labor force is projected to increase more than the number of women in any other age group—increasing by 89.8 percent, or 2,030,000.
Although projected to be the smallest in number among all age groups, the number of women in the civilian labor force aged 75 years and older is projected to have the second highest increase—61.4 percent, or 336,000. The number of women aged 16 to 19, as well as those aged 35 to 54, is projected to decrease over that same period.
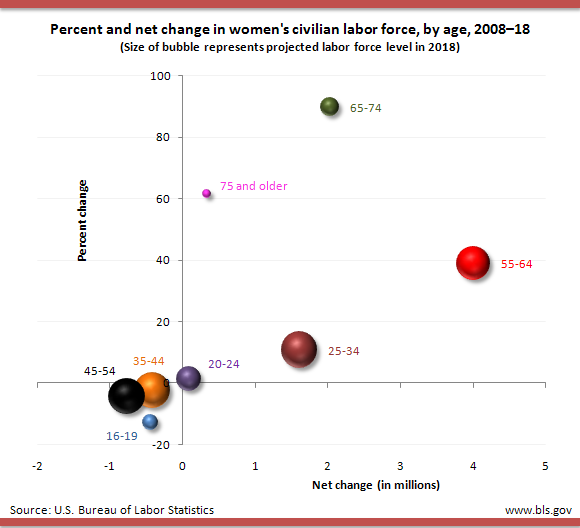
Source: Employment Projections Program | Chart Data
More BLS Data Related to Women
Data from the Current Population Survey (CPS) related to women appear in two annual publications: Women in the Labor Force: A Databook and Highlights of Women's Earnings. Links to current and archived editions of these two publications can be found under the "Women" header on the CPS Demographics page. The Overview of BLS Statistics on Women Workers page contains links to data from the CPS and other BLS programs.
Also, see the archived articles from The Editor's Desk and Monthly Labor Review.
Note: Data in text, charts, and tables are the latest available at the time of publication. Internet links may lead to more recent data.
General Information: (202) 691-5200
Media Contact: (202) 691-5902
|