
|
| December 15, 2011 |
|
| Name of MSA or Division a,b,c | Areas Included within MSA or Division | Report Abbreviation |
|---|---|---|
| Boston-Cambridge-Quincy, MA-NH, MSA | Essex County, MA; Middlesex County, MA; Norfolk County, MA; Plymouth County, MA; Suffolk County, MA; Rockingham County, NH; and Strafford County, NH | Boston |
| Chicago-Naperville-Joliet, IL-IN-WI, MSA | Cook County, IL; DeKalb County, IL; DuPage County, IL; Grundy County, IL; Kane County, IL; Kendall County, IL; Lake County, IL; McHenry County, IL; Will County, IL; Jasper County, IN; Lake County, IN; Newton County, IN; Porter County, IN; and Kenosha County, WI | Chicago |
| Denver-Aurora, CO, MSA | Denver, CO; Aurora, CO; Adams County, CO; Arapahoe County, CO; Broomfield County, CO; Clear Creek County, CO; Denver County, CO; Douglas County, CO; Elbert County, CO; Gilpin County, CO; Jefferson County, CO; and Park County, CO | Denver |
| Detroit-Warren-Livonia, MI, MSA | Detroit, MI; Warren, MI; Livonia, MI; Dearborn, MI; Farmington Hills, MI; Troy, MI; Southfield, MI; Pontiac, MI; and Taylor, MI | Detroit |
| Miami-Dade County Division | Miami, FL; Miami Beach, FL; and Dade County, FL | Miami-Dade |
| Miami-Fort Lauderdale Division | Fort Lauderdale, FL; Pompano Beach, FL; Deerfield Beach, FL; West Palm Beach, FL; Boca Raton, FL; Boynton Beach, FL; Broward County, FL; and Palm Beach County, FL | Fort Lauderdale |
| Minneapolis-St. Paul-Bloomington, MN-WI, MSA | Minneapolis, MN; St. Paul, MN; Bloomington, MN; Plymouth, MN; Eagan, MN; Eden Prairie, MN; Minnetonka, MN; Anoka County, MN; Carver County, MN; Chisago County, MN; Dakota County, MN; Hennepin County, MN; Isanti County, MN; Ramsey County, MN; Scott County, MN; Sherburne County, MN; Washington County, MN; Wright County, MN; Pierce County, WI; and St. Croix County, WI | Minneapolis |
| New York-5 Boroughs Division | The New York-5 Boroughs Division includes Bronx County, NY [Bronx]; Kings County, NY [Brooklyn]; New York County, NY [Manhattan]; Queens County, NY [Queens]; and Richmond County, NY [Staten Island] | New York City |
| Phoenix-Mesa-Scottsdale, AZ, MSA | Maricopa County, AZ, and Pinal County, AZ | Phoenix |
| San Francisco Metropolitan Division | Marin County, CA; San Mateo County, CA; and San Francisco County, CA | San Francisco |
| Seattle-Tacoma-Bellevue, WA, MSA | Seattle, WA; Tacoma, WA; Bellevue, WA; Everett, WA; Kent, WA; and Renton, WA | Seattle |
| a Data for each MSA or division are representative of the 24-hour, general purpose EDs in that area. b Unless otherwise noted, DAWN defines metropolitan areas using the MSA and division definitions issued by the Office of Management and Budget (OMB) in June 2003 (http://www.whitehouse.gov/omb/bulletins_b03-04). DAWN uses these names and definitions even if the names or composition were changed by OMB. More detailed information about these areas may be accessed at: http://www.oas.samhsa.gov/2k11/DAWN2009Methods/DAWN2k9_MethodologyReport.htm c DAWN reports metropolitan area estimates for 13 metropolitan areas. In this report, two areas were excluded: the Houston-Baytown-Sugar Land, TX, MSA (or “Houston”) and the San Diego-Carlsbad-San Marcos, CA, MSA (or “San Diego”). Both were excluded because the 2009 estimates were unreliable due to low representation in those areas for that year. |
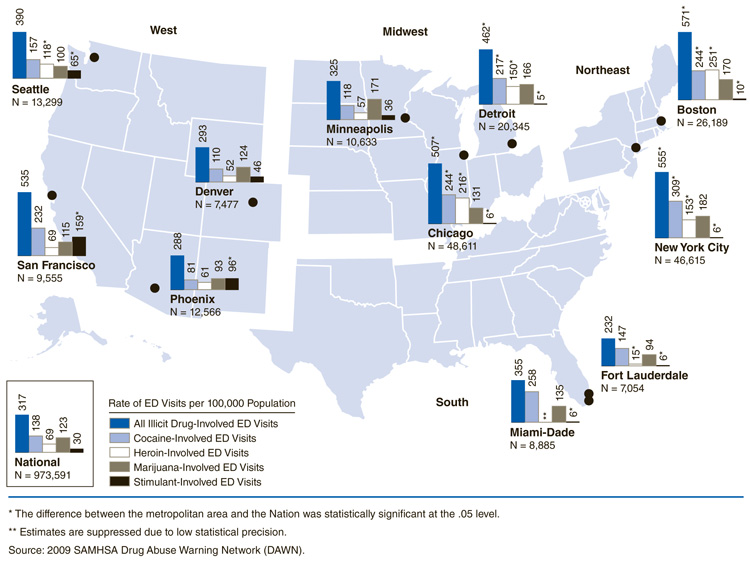
In 2009, there were an estimated 973,591 ED visits involving illicit drug use in the Nation as a whole, which occurred at a rate of 317 per 100,000 pop. (Figure 1). Four metropolitan areas had significantly higher rates than the Nation for ED visits involving illicit drugs: Boston (571 per 100,000 pop.), New York City (555 per 100,000 pop.), Chicago (507 per 100,000 pop.), and Detroit (462 per 100,000 pop.).
|
| Area | Estimated Number of ED Visits Involving Illicit Drugs | Rate of All Illicit Drug-Involved ED Visits per 100,000 Population | Rate of Cocaine-Involved ED Visits per 100,000 Population | Rate of Heroin-Involved ED Visits per 100,000 Population | Rate of Marijuana-Involved ED Visits per 100,000 Population | Rate of Stimulant-Involved ED Visits per 100,000 Population |
|---|---|---|---|---|---|---|
| National | 973,591 | 317 | 138 | 69 | 123 | 30 |
| Northeast | ||||||
| Boston | 26,189 | 571* | 244* | 251* | 170 | 10* |
| New York City | 46,615 | 555* | 309* | 153* | 182 | 6* |
| Midwest | ||||||
| Chicago | 48,611 | 507* | 244* | 216* | 131 | 6* |
| Detroit | 20,345 | 462* | 217* | 150* | 166 | 5* |
| Minneapolis | 10,633 | 325 | 118 | 57 | 171 | 36 |
| South | ||||||
| Fort Lauderdale | 7,054 | 232 | 147 | 15* | 94 | 6* |
| Miami-Dade | 8,885 | 355 | 258 | ** | 135 | 6* |
| West | ||||||
| Denver | 7,477 | 293 | 110 | 52 | 124 | 46 |
| Phoenix | 12,566 | 288 | 81 | 61 | 93 | 96* |
| San Francisco | 9,555 | 535 | 232 | 69 | 115 | 159* |
| Seattle | 13,299 | 390 | 157 | 118* | 100 | 65* |
| * The difference between the metropolitan area and the Nation was statistically significant at the .05 level. ** Estimates are suppressed due to low statistical precision. Source: 2009 SAMHSA Drug Abuse Warning Network (DAWN). |
Differences by specific illicit drugs were examined by metropolitan area, including cocaine, marijuana, heroin, and stimulants (i.e., amphetamines and methamphetamines). The national rate for ED visits involving cocaine was 138 per 100,000 pop. in 2009 (Figure 1). Compared with the national rate, the rates of ED visits involving cocaine were significantly higher in New York City (309 per 100,000 pop.), Boston (244 per 100,000 pop.), Chicago (244 per 100,000 pop.), and Detroit (217 per 100,000 pop.).
The national rate of ED visits involving heroin was 69 per 100,000 pop. (Figure 1). In comparison, the rates of ED visits involving heroin were significantly higher in Boston (251 per 100,000 pop.), Chicago (216 per 100,000 pop.), New York City (153 per 100,000 pop.), Detroit (150 per 100,000 pop.), and Seattle (118 per 100,000 pop.).
Nationally, ED visits involving stimulants occurred at a rate of 30 per 100,000 pop. (Figure 1). Rates of ED visits involving stimulants were significantly higher than those in the Nation as a whole in San Francisco (159 per 100,000 pop.), Phoenix (96 per 100,000 pop.), and Seattle (65 per 100,000 pop.). Several metropolitan areas (all with rates of 10 per 100,000 pop. or less)—including Boston, Fort Lauderdale, Miami-Dade, Chicago, New York City, and Detroit—had lower rates than those in the Nation as a whole.
The rates of ED visits involving marijuana ranged from 93 per 100,000 pop. (Phoenix) to 182 per 100,000 pop. (New York City) (Figure 1). None of the metropolitan areas had rates that were statistically different from the national rate (123 per 100,000 pop.).
ED visits involving illicit drugs in combination with other substances—including alcohol and pharmaceuticals—were examined to determine if there were any geographic differences. Nationally, the rate of visits involving illicit drugs only was 155 per 100,000 pop. (Figure 2). Five metropolitan areas had significantly higher rates than the Nation: San Francisco (328 per 100,000 pop.), Chicago (313 per 100,000 pop.), Boston (275 per 100,000 pop.), New York City (260 per 100,000 pop.), and Detroit (251 per 100,000 pop.).

|
| Area | Rate | ||||
|---|---|---|---|---|---|
| Nation | 155 | ||||
| Northeast | |||||
| Boston* | 275 | ||||
| New York City* | 260 | ||||
| Midwest | |||||
| Chicago* | 313 | ||||
| Detroit* | 251 | ||||
| Minneapolis | 146 | ||||
| South | |||||
| Fort Lauderdale | 112 | ||||
| Miami-Dade | 184 | ||||
| West | |||||
| Denver | 143 | ||||
| Phoenix | 161 | ||||
| San Francisco* | 328 | ||||
| Seattle | 229 | ||||
| * The difference between the metropolitan area and the Nation was statistically significant at the .05 level. Source: 2009 SAMHSA Drug Abuse Warning Network (DAWN). |
Nationally, ED visits involving illicit drugs in combination with alcohol occurred at a rate of 69 per 100,000 pop. (Figure 3). Five metropolitan areas had significantly higher rates: New York City (223 per 100,000 pop.), Boston (153 per 100,000 pop.), San Francisco (150 per 100,000 pop.), Chicago (120 per 100,000 pop.), and Detroit (112 per 100,000 pop.).

|
| Area | Rate | ||||
|---|---|---|---|---|---|
| Nation | 69 | ||||
| Northeast | |||||
| Boston* | 153 | ||||
| New York City* | 223 | ||||
| Midwest | |||||
| Chicago* | 120 | ||||
| Detroit* | 112 | ||||
| Minneapolis | 106 | ||||
| South | |||||
| Fort Lauderdale | 50 | ||||
| Miami-Dade | 111 | ||||
| West | |||||
| Denver | 90 | ||||
| Phoenix | 61 | ||||
| San Francisco* | 150 | ||||
| Seattle | 84 | ||||
| * The difference between the metropolitan area and the Nation was statistically significant at the .05 level. Source: 2009 SAMHSA Drug Abuse Warning Network (DAWN). |
The national rate for ED visits involving illicit drugs combined with pharmaceuticals was 67 per 100,000 pop. There were no statistically significant differences found when the metropolitan area rates were compared against the national rate for ED visits involving these combinations. Rates of ED visits for these combinations ranged from 35 per 100,000 pop. (Miami-Dade) to 92 per 100,000 pop. (Boston).
The 2011 National Prevention Strategy encourages local governments to reduce drug use and its associated negative outcomes and highlights the accomplishments of the Drug Free Communities Program.3 ED data can help identify how often specific illicit drugs are involved in medical emergencies; such local information on drug abuse and its negative consequences can be used to plan for prevention activities, emergency medical services, and treatment needs. As local governments and health care facilities develop policies and strive to use their resources as effectively as possible, ED data can be used to help officials make decisions about current and emerging drug abuse-related issues.
|
The Drug Abuse Warning Network (DAWN) is a public health surveillance system that monitors drug-related morbidity and mortality. DAWN uses a probability sample of hospitals to produce estimates of drug-related emergency department (ED) visits for the United States and selected metropolitan areas annually. DAWN also produces annual profiles of drug-related deaths reviewed by medical examiners or coroners in selected metropolitan areas and States. Any ED visit related to recent drug use is included in DAWN. All types of drugs—licit and illicit—are covered. Alcohol involvement is documented for patients of all ages if it occurs with another drug. Alcohol is considered an illicit drug for minors and is documented even if no other drug is involved. The classification of drugs used in DAWN is derived from the Multum Lexicon, copyright 2010 Lexi-Comp, Inc., and/or Cerner Multum, Inc. The Multum Licensing Agreement governing use of the Lexicon can be found at http://dawninfo.samhsa.gov/drug_vocab. DAWN is one of three major surveys conducted by the Substance Abuse and Mental Health Services Administration's Center for Behavioral Health Statistics and Quality (SAMHSA/CBHSQ). For more information on other CBHSQ surveys, go to http://www.oas.samhsa.gov/. SAMHSA has contracts with Westat (Rockville, MD) and RTI International (Research Triangle Park, NC) to operate the DAWN system and produce publications. For publications and additional information about DAWN, go to http://DAWNinfo.samhsa.gov/. |
| The DAWN Report is published periodically by the Center for Behavioral Health Statistics and Quality (formerly the Office of Applied Studies), Substance Abuse and Mental Health Services Administration (SAMHSA). All material appearing in this report is in the public domain and may be reproduced or copied without permission from SAMHSA. Additional copies of this report or other reports from the Center for Behavioral Health Statistics and Quality are available online: http://samhsa.gov/data/. Citation of the source is appreciated. For questions about this report, please e-mail: shortreports@samhsa.hhs.gov.
DAWN_023 |
This page was last updated on October 11, 2010. |