
| Accessing and Analyzing the NHSDA Online
|
|
In Brief
|
- Over 75 studies, including the National Household Survey on Drug Abuse from 1979 to 1998, are publicly available from the Substance Abuse and Mental Health Data Archive (SAMHDA) at http://www.icpsr.umich.edu/SAMHDA
- Program administrators, researchers, and others with Internet access may run their own analyses without using specialized software
- Hypertext links on the input screens provide online help
|
| |
If you were interested in determining the average age at which men versus women begin using crack cocaine, where would you begin? What if you needed to know whether drug use patterns differed between your region of the country and all other regions, or about differences in drug use based on age, gender, education, race, and ethnicity? Suppose you would like to investigate whether or not HIV risk behaviors involving drug use have decreased over time?
The National Household Survey on Drug Abuse (NHSDA) provides answers to these questions, as well as many others. Conducted annually, the NHSDA surveys respondents aged 12 and older about their use of licit and illicit drugs and includes topics such as mental health; access to health care; perception of need for substance abuse treatment, treatment received, and payment source; driving and use of drugs or alcohol; and diagnostic criteria for dependence. Questions for 12- to 17-year-old respondents cover exposure to substance abuse education, extracurricular activities, neighborhood environment, gang involvement, and substance use by friends.
NHSDA data are freely available to you via the Web site for the Substance Abuse and Mental Health Data Archive (SAMHDA): http://www.icpsr.umich.edu/SAMHDA.1 The archive maintains an online data analysis system (DAS) that permits users to analyze variables in selected datasets, including the NHSDA, through their Web browser.2 This system provides a quick and easy way for program administrators, policymakers, researchers, and others to run their own analyses without the need for specialized software-all that is necessary is Internet access. You will need at least basic statistical ability to use the system. Hypertext links on the input screens provide quick reference to terms, options, and syntax.3 |
DAS Capabilities
The DAS allows you to run simple analyses such as a two-way cross tabulation, as well as more complex procedures like multiple regression. The DAS also permits you to select customized subsets of the data for downloading to your PC (e.g., records for a particular state or another group within the data such as women or respondents between certain ages). An abbreviated HTML codebook is available for consultation through the duration of a DAS session. The codebook lists the questions that were asked of respondents, the unweighted frequency of each response, and variable names.
Analyzing the NHSDA Online
You may access the NHSDA by selecting "Data and Surveys" on the SAMHDA site, then selecting the NHSDA from among the studies currently available. From the NHSDA page, select the "Data Analysis System" link.
Users may also select the "Data Analysis System" link on SAMHDA's home page and then select the NHSDA.
Next, select the year of the study for which you want to run analyses. A separate dataset exists for each year that the survey was administered: 1979, 1982, 1985, 1988, and 1990-1998. The 1999 data will be uploaded as soon as they are available. To select a dataset, simply click on its link. Once a dataset has been selected, the DAS interface page specifying user options appears. Various analytic procedures can be initiated from this interface. It is helpful at this point to select the "Extra Codebook Window" button so that you may toggle between the codebook and analytic windows. See Figure 1.
|
Figure 1. |

|
|
|
An Example Using the DAS
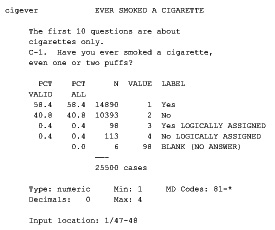
As an example, let's say you are interested in exploring the association between marijuana use and cigarette smoking. The first step is to consult the codebook to determine the variables that would address this and obtain their variable names. From the 1998 NHSDA codebook we find that the variable CIGEVER contains responses to the question "Have you ever smoked a cigarette, even one or two puffs?" Likewise, the variable MJEVER represents the question "Have you ever, even once, used marijuana or hashish?" Figure 2 shows an excerpt from the 1998 NHSDA codebook for "CIGEVER".
The appropriate function for this type of analysis is a crosstabulation; this procedure generates the distribution of values for one variable across the categories of another. Crosstabulation allows us to detect associations between variables. Does cigarette smoking contribute to a higher probability of marijuana use? Comparing the percentage of marijuana users for each category of cigarette use will suggest an answer.
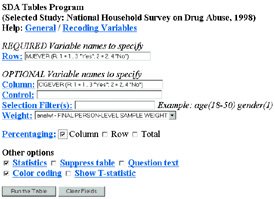
To initiate the procedure, select "Run frequency or crosstabulation" and enter the variable names into the row and column fields of the SDA Tables Program. Variable names can be entered in upper or lower case. In our example we place MJEVER in the row field and CIGEVER in the column field. Since we are looking for variations in marijuana use across cigarette smoking categories, we calculate column percentages.4
|
Figure 2. |
|
Additional DAS Features
The NHSDA uses "logically assigned" values for questions to which the respondent may not have responded but for which an answer could be inferred. Separate codes are provided in the data file for logically assigned responses. Both MJEVER and CIGEVER have logically assigned values. For purposes of analysis, these can be recoded so that all yes responses ("YES" AND "YES, LOGICALLY ASSIGNED") and all no responses ("NO" AND "NO, LOGICALLY ASSIGNED") are combined. As shown in Figure 3, codes 1 and 3 are combined for "1-YES" and codes 2 and 4 are combined for "2-NO".
The DAS allows users to control the results for particular groupings (e.g., controlling by the sex variable will generate three separate tables, one for men, one for women, and one for both men and women). The program also allows users to restrict the findings to a particular segment or subset of the data by specifying a filter (e.g., age or region of the country). If you do not wish to use these options, simply leave the fields blank. Weight variables are used to adjust calculations to compensate for different probabilities of selection and for various potential sources of bias. For the NHSDA, the DAS has a pre-specified weight variable that is used unless you opt not to use it. It is usually a good idea to use the weight variable, however, so that percentages and other statistics more accurately represent the population from which the data were collected.
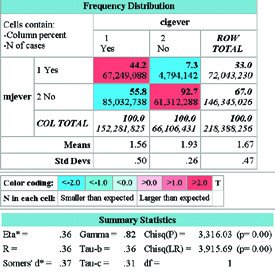
Other user options such as generating inferential statistics and color-coding the results table may be selected. Finally, to produce the table, select "Run the table" at the bottom of the screen. Figure 4 shows the results of crosstabulating CIGEVER and MJEVER, with recoding, column percentages, statistics, and color-coding.
We immediately see from the color-coding that the data show significant differences. Red cells in the table show results that are greater than would be expected by chance; blue cells represent results that are less than would be expected by chance. Examining the column percentages we see that, of respondents who reported ever having smoked cigarettes, 44.2 percent have also smoked marijuana while just 7.3 percent of those who have never used cigarettes have used marijuana. Conversely, 55.8 percent of cigarette smokers have never tried marijuana while 92.7 percent of non-cigarette smokers have never tried marijuana. Furthermore, looking at the statistics produced in the table, we see that the p-value based on chi square is p<.05, indicating that the differences shown in the table are statistically significant. The "N of cases" represents the estimated number of persons in the U.S. included in each cell.
Based on this finding, you can direct the DAS to answer new questions-for instance, are other measures of cigarette use (such as recency, frequency, length, or age of first use) associated with marijuana use? Are these variables associated with the use of drugs other than marijuana? The NHSDA contains hundreds of variables and provides a rich source of information on drug use across the country to provide answers to these and numerous other questions.
|
Figure 3. |
Figure 4. |
|
|
Additional Information
If you have questions or would like additional information on the DAS or any other data issues, please contact the archive at: SAMHDA/ICPSR, 426 Thompson, Ann Arbor, MI 48109, (888) 741-7242 (toll-free helpline), or samhda@icpsr.umich.edu (email).
|
Current SAMHDA Holdings
|
- National Household Survey on Drug Abuse (NHSDA)
- Treatment Episode Data Set (TEDS)
- Uniform Facility Data Set (UFDS)
- Monitoring the Future (MTF)
- Drug Abuse Treatment Outcomes Study (DATOS)
- National Treatment Improvement Evaluation Study (NTIES)
- (Washington) DC Metropolitan Area Drug Study (DC*MADS)
- Drug Abuse Warning Network (DAWN)
- Health Behavior in School-aged Children (HBSC)
- National Pregnancy and Health Survey (NPHS)
- Services Research Outcomes Study (SROS)
- Gambling Impact and Behavior Study
- National Comorbidity Survey (NCS)
- National Youth Survey (NYS)
- Policy Research on Aging and Mental Health Services (PRAMHS)
| The National Household Survey on Drug Abuse (NHSDA) is an annual survey sponsored by the Substance Abuse and Mental Health Services Administration (SAMHSA). The 1999 data are based on information obtained from nearly 70,000 persons aged 12 or older. The survey collects data by administering questionnaires to a representative sample of the population through face-to-face interviews at their place of residence.
This NHSDA Report was prepared by the
Office
of Applied Studies (OAS), SAMHSA, ICPSR, and by RTI in Research Triangle Park, North Carolina.
|
|
End Notes
1The archive is supported by the Office of Applied Studies at SAMHSA and based at the Inter-university Consortium for Political and Social Research (ICPSR) though a sub-contract with the National Opinion Research Center (NORC).
2 The raw data (ASCII) also may be downloaded from the archive, with documentation provided in Portable Document Format (PDF).
3 The software powering this system, developed by the Computer-assisted Survey Methods Program at the University of California at Berkeley, is called "Survey Documentation and Analysis" (SDA). For more about the software, see: http://sda.berkeley.edu.
4 The dependent, or response, variable is MJEVER and the independent, or explanatory variable is CIGEVER. One way of thinking about these variables is that the goal of the analysis is to determine the degree to which the response variable (MJEVER) depends on the group to which the subject belongs within the explanatory variable (having smoked or not smoked cigarettes).
The NHSDA Report is published periodically by the
Office of Applied Studies, Substance Abuse and Mental Health Services Administration (SAMHSA). All material appearing in this report is in the public domain and may be reproduced or copied without permission from
SAMHSA. Additional copies of this fact sheet may be downloaded from
Other reports from the Office of Applied Studies are also available
on-line on the OAS home page: http://www.oas.samhsa.gov
|
|
This page was last updated on December 31, 2008.
|