National Household Survey on Drug Abuse Academic Performance and Youth Substance Use Report

September 6, 2002

Academic Performance and Youth Substance Use

In Brief

  • Youths who received grades of D or below last semester were more likely than those with higher grades to have used cigarettes, alcohol, or illicit drugs during the past month
  • Youths with an A or B average were more likely to have used alcohol than other substances during the past month, but youths with a D or less than D average were more likely to have used cigarettes than other substances during this time period
  • The likelihood of participating in two or more youth activities was highest for youths with an A average and lowest for youths with a D or less than D average

The National Household Survey on Drug Abuse (NHSDA) asks respondents aged 12 or older to report use of alcohol, cigarettes, or any illicit drug during the month prior to the survey. "Any illicit drug" refers to marijuana/hashish, cocaine (including crack), inhalants, hallucinogens, heroin, or prescription-type drugs used nonmedically. Youths aged 12 to 17 who reported being enrolled in school during the past year were asked about their average grades in school for the last semester or grading period completed. Youths were also asked about their participation in youth activities during the past year.1


Prevalence of Alcohol, Cigarette, and Illicit Drug Use Among Youths
According to the 2000 NHSDA, over 16 percent of youths aged 12 to 17 reported drinking alcohol during the past month, more than 13 percent reported past month use of cigarettes, and almost 10 percent reported past month use of an illicit drug (Table 1). These percentages translate to almost 4 million past month alcohol users, an estimated 3 million past month cigarette users, and more than 2 million past month illicit drug users among youths. Among youths, 7 percent reported past month marijuana use, and almost 5 percent reported past month use of an illicit drug other than marijuana.

Figure 1. Percentages of Youths Aged 12 to 17 Enrolled in School During the Past Year Reporting Average Letter Grades for the Last Semester or Grading Period Completed: 2000

Figure 2. Percentages of Youths Aged 12 to 17 Enrolled in School During the Past Year Reporting Past Month Substance Use, by Average Letter Grade for the Last Semester or Grading Period Completed: 2000

Figure 1.  Percentages of Youths Aged 12 to 17 Enrolled in School During the Past Year Reporting Average Letter Grades for the Last Semester or Grading Period Completed: 2000 Figure 2.  Percentages of Youths Aged 12 to 17 Enrolled in School During the Past Year Reporting Past Month Substance Use, by Average Letter Grade for the Last Semester or Grading Period Completed: 2000

Academic Performance and the Use of Cigarettes, Alcohol, or Illicit Drugs
In 2000, more than 29 percent of youths aged 12 to 17 enrolled in school reported an A average for the last semester or grading period completed, 41 percent reported a B average, 23 percent reported a C average, and 7 percent reported a D or less than D average (Figure 1).2 Prior research has associated poor grades with substance use among youths.3,4 Results from the 2000 NHSDA indicated that rates of past month use of cigarettes, alcohol, or any illicit drug increased with decreasing grades (Figure 2). For example, 6 percent of youths with an A average smoked cigarettes during the past month compared with 13 percent of those with a B average, 20 percent of those with a C average, and 36 percent of those with a D or less than D average. Youths with an A or B average were more likely to have used alcohol than cigarettes or an illicit drug during the past month. However, youths with a D or less than D average were more likely to have used cigarettes than alcohol or an illicit drug during this time period.


Academic Performance and Participation in Youth Activities
Prior research has identified a relationship between academic performance and youth activities.5 Results from the 2000 NHSDA indicate that the likelihood of participating in two or more youth activities was highest for youths with an A average and lowest for youths with a D or less than D average (Figure 3). Youths who participated in two or more youth activities during the past year were less likely than those who participated in one or fewer youth activities to have used cigarettes, alcohol, or an illicit drug during the past month (Figure 4). For example, 16 percent of youths who participated in two or more youth activities during the past year used alcohol during the past month compared with 22 percent of youths who participated in one or fewer youth activities. Youths who participated in one or fewer youth activities in the past year were twice as likely to have used an illicit drug in the past month compared with youths who participated in two or more youth activities.

Figure 3. Percentages of Youths Aged 12 to 17 Enrolled in School During the Past Year Reporting Participation in Two or More Youth Activities** During the Past Year, by Average Letter Grade for the Last Semester or Grading Period Completed: 2000

Figure 4. Percentages of Youths Aged 12 to 17 Enrolled in School During the Past Year Reporting Past Month Substance Use, by Number of Youth Activities Participated In** During the Past Year: 2000

Figure 3.  Percentages of Youths Aged 12 to 17 Enrolled in School During the Past Year Reporting Participation in Two or More Youth Activities** During the Past Year, by Average Letter Grade for the Last Semester or Grading Period Completed: 2000 Figure 4.  Percentages of Youths Aged 12 to 17 Enrolled in School During the Past Year Reporting Past Month Substance Use, by Number of Youth Activities Participated In** During the Past Year: 2000

Table 1. Estimated Numbers (in Thousands) and Percentages of Youths Aged 12 to 17 Reporting Past Month Substance Use: 2000

Table 1.  Estimated Numbers (in Thousands) and Percentages of Youths Aged 12 to 17 Reporting Past Month Substance Use: 2000

End Notes

  1. The 10 selected youth activities were youth center activities, Scouts, private lessons, team sports, 4-H club, volunteer work, church choir, school clubs, student government, and school band.
  2. Approximately 69 percent of surveyed youths aged 12 to 17 were included in these analyses. The remaining 31 percent of youths either attended schools that did not give letter grades, left the question blank, did not attend school, or were not asked about letter grades.
  3. Hawkins, J.D., Catalano, R.F., & Miller, J.Y. (1992). Risk and protective factors for alcohol and other drug problems in adolescence and early adulthood: Implications for substance abuse prevention. Psychological Bulletin, 112(1), 64-105.
  4. Lane, J., Gerstein, D., Huang, L., & Wright, D. (2001). Risk and protective factors for adolescent drug use: Findings from the 1997 National Household Survey on Drug Abuse (Analytic Series: A-12, DHHS Publication No. SMA-01-3499). Rockville, MD: Substance Abuse and Mental Health Services Administration.
  5. Black, S. (2002, June). The well-rounded student. American School Board Journal, 189, Retrieved August 12, 2002, from http://www.asbj.com/2002/06/0602research.html.


Figure and Table Notes

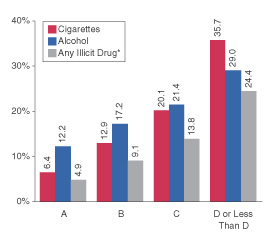
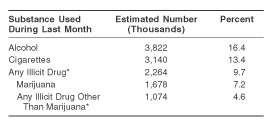
* Any illicit drug refers to marijuana/hashish, cocaine (including crack), inhalants, hallucinogens, heroin, or any prescription-type drugs used nonmedically. Any illicit drug other than marijuana indicates use at least once of any of these listed drugs, regardless of marijuana/hashish use; marijuana/hashish users who also have used any of the other listed drugs are included.

**Respondents aged 12 to 17 who reported not being enrolled in school during the past year or those who did not answer 5 or more of the selected activity questions with a "yes" or "no" response were excluded. The 10 selected youth activities were youth center activities, Scouts, private lessons, team sports, 4-H club, volunteer work, church choir, school clubs, student government, and school band.

Source (table and all figures): http://www.oas.samhsa.gov/NHSDA/2kNHSDA/2knhsda.htm

The National Household Survey on Drug Abuse (NHSDA) is an annual survey sponsored by the Substance Abuse and Mental Health Services Administration (SAMHSA). The 2000 data are based on information obtained from nearly 72,000 persons aged 12 or older, including more than 25,000 youths aged 12 to 17. The survey collects data by administering questionnaires to a representative sample of the population through face-to-face interviews at their place of residence.

The NHSDA Report is prepared by the Office of Applied Studies (OAS), SAMHSA, and by RTI in Research Triangle Park, North Carolina.

Information and data for this issue are based on the following publication and statistics:

Substance Abuse and Mental Health Services Administration. (2001). Summary of findings from the 2000 National Household Survey on Drug Abuse (NHSDA Series: H-13, DHHS Publication No. SMA 01-3549). Rockville, MD: Author.

Also available on-line: http://www.oas.samhsa.gov/nsduh.htm.

Additional Tables 1.2A and 1.2B from http://www.oas.samhsa.gov/nhsda/2kdetailedtabs/Vol_1_Part_1/V1P1.htm and

Tables 2.2A and 2.2B from http://www.oas.samhsa.gov/nhsda/2kdetailedtabs/Vol_1_Part_2/V1P2.htm and

Table 3.40B from http://www.oas.samhsa.gov/nhsda/2kdetailedtabs/Vol_1_Part_3/V1P3.htm.

Additional tables available upon request.

The NHSDA Report is published periodically by the Office of Applied Studies, Substance Abuse and Mental Health Services Administration (SAMHSA). All material appearing in this report is in the public domain and may be reproduced or copied without permission from SAMHSA. Additional copies of this fact sheet may be downloaded from Other reports from the Office of Applied Studies are also available on-line on the OAS home page: http://www.oas.samhsa.gov

This page was last updated on December 31, 2008.