National Household Survey on Drug Abuse Alcohol Use Report

December 14, 2001

Alcohol Use

In Brief

  • In 2000, rates of binge alcohol use and heavy alcohol use were highest among young adults aged 21 to 25

  • Underage past month alcohol use was highest among whites, followed by American Indians/Alaska Natives

  • Whites were more likely than Hispanics, blacks, and Asians to report driving under the influence of alcohol during the past year

The 1999 and 2000 National Household Surveys on Drug Abuse (NHSDAs) asked respondents aged 12 or older to report alcohol use during the month prior to the survey, including the quantity and frequency of use. Binge alcohol use was defined as drinking five or more drinks on the same occasion (at the same time or within a couple of hours of each other) on at least 1 day in the past 30 days. A drink was defined as a can or bottle of beer, a glass of wine or a wine cooler, a shot of liquor, or a mixed drink containing liquor. Heavy alcohol use was defined as drinking five or more drinks on the same occasion on each of 5 or more days in the past 30 days. Respondents were also asked about driving under the influence of alcohol during the year before the survey.


Past Month Alcohol Use

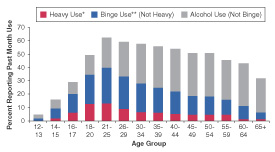
In 2000, 47 percent of Americans aged 12 or older (approximately 104 million people) indicated that they had used alcohol during the month prior to the survey, including 21 percent (46 million people) who reported binge drinking and 6 percent (almost 13 million people) who reported heavy drinking. Rates of past month alcohol use increased with increasing age during youth and young adulthood, from 2 percent at age 12 to a peak of 65 percent at age 21. The highest rates of both binge and heavy drinking were for young adults aged 21 to 25 (Figure 1), with the peak rate occurring at age 21 (45 percent binge drinking and 17 percent heavy drinking). Binge and heavy alcohol use rates decreased faster with age than did rates of past month alcohol use.


Underage Alcohol Use

Nearly 10 million people aged 12 to 20 (28 percent of this age group) reported drinking alcohol in the month prior to the 2000 survey. Of those individuals, almost 7 million (19 percent) were binge drinkers and 2 million (6 percent) were heavy drinkers. Combined 1999 and 2000 data show that past month alcohol rates were highest among underage whites (31 percent), followed by American Indians/Alaska Natives (28 percent) (Figure 2). Among Hispanic subgroups, rates of past month alcohol use ranged from 25 percent among Mexicans to 22 percent among both Central/South Americans and Cubans. Almost 19 percent of blacks reported past month use. Among Asian subgroups, rates of past month use ranged from 21 percent for Koreans to 8 percent among Vietnamese.

Figure 1. Percentages of Persons Aged 12 or Older Reporting Past Month Alcohol Use, by Level of Use and Age Group: 2000

Figure 2. Percentages of Persons Aged 12 to 20 Reporting Past Month Alcohol Use, by Race/Ethnicity: 1999-2000 Annual Averages

Figure 1.  Percentages of Persons Aged 12 or Older Reporting Past Month Alcohol Use, by Level of Use and Age Group: 2000 Figure 2.  Percentages of Persons Aged 12 to 20 Reporting Past Month Alcohol Use, by Race/Ethnicity:  1999-2000 Annual Averages

Geographic Area

Among persons aged 12 or older in 2000, the rates of past month alcohol use were highest in large metropolitan areas (50 percent), followed by small metropolitan areas (46 percent) and non-metropolitan areas (40 percent).1 Within non-metropolitan areas, the rates of past month use were lowest in completely rural areas (36 percent). Patterns of alcohol use in different county types varied by age group. Among youths aged 12 to 17, the rates of past month alcohol use were higher in rural areas than in large metropolitan areas. For young adults aged 18 to 25, the rates of past month alcohol use were higher in large metropolitan areas than rural areas. Rates of past month use for adults aged 26 or older were greater in large metropolitan areas than in rural areas.

Rates of binge and heavy drinking showed a different pattern across county types. Among youths aged 12 to 17 and adults aged 26 or older, the rates of heavy alcohol use were higher in rural areas than in large metropolitan areas (Figure 3). No difference in heavy use rates was found for young adults aged 18 to 25 across these county types.

Figure 3. Percentages of Persons Aged 12 or Older Reporting Heavy Alcohol Use,* by County Type and Age Group: 2000

Figure 4. Percentages of Persons Aged 12 or Older Reporting Driving Under the Influence of Alcohol During the Past Year, by Detailed Age Categories: 2000

Figure 3.  Percentages of Persons Aged 12 or Older Reporting Heavy Alcohol Use,* by County Type and Age Group:  2000 Figure 4.  Percentages of Persons Aged 12 or Older Reporting Driving Under the Influence of Alcohol During the Past Year, by Detailed Age Categories: 2000

Figure 5. Percentages of Persons Aged 12 or Older Reporting Driving Under the Influence of Alcohol During the Past Year, by Race/Ethnicity: 2000

Figure 5.  Percentages of Persons Aged 12 or Older Reporting Driving Under the Influence of Alcohol During the Past Year, by Race/Ethnicity:  2000


Driving Under the Influence of Alcohol

In 2000, over 22 million persons aged 12 or older reported drinking and driving during the past year. Rates of past year driving under the influence of alcohol increased with increasing age during youth and young adulthood, from less than 1 percent among 12 and 13 year olds to a peak of 24 percent among 22 year olds (Figure 4). Males (14 percent) were more likely than females (6 percent) to report past year driving under the influence of alcohol. Whites (11 percent) were significantly more likely than Hispanics (7 percent), blacks (7 percent), and Asians (5 percent) to report this behavior (Figure 5).


End Note
1 Large metropolitan areas have a population of 1 million or more. Small metropolitan areas have a population of less than 1 million. Non-metropolitan areas are outside of Metropolitan Statistical Areas (MSAs), as defined by the Office of Management and Budget. Completely rural counties have fewer than 2,500 population in urbanized areas.


Figure Notes
* Heavy alcohol use is defined as drinking five or more drinks on the same occasion on each of 5 or more days in the past 30 days; all heavy alcohol users are also binge alcohol users. By "occasion" is meant at the same time or within a couple of hours of each other.

**Binge alcohol use is defined as drinking five or more drinks on the same occasion on at least 1 day in the past 30 days.

Source (Figs. 1, 3, 4 & 5): SAMHSA 2000 NHSDA.

Source (Fig. 2): SAMHSA 1999 and 2000 NHSDAs.


The National Household Survey on Drug Abuse (NHSDA) is an annual survey sponsored by the Substance Abuse and Mental Health Services Administration (SAMHSA). The 1999 and 2000 data are based on information obtained from approximately 70,000 persons aged 12 or older each year. The survey collects data by administering questionnaires to a representative sample of the population through face-to-face interviews at their place of residence.

The NHSDA Report is prepared by the Office of Applied Studies (OAS), SAMHSA, and by RTI in Research Triangle Park, North Carolina. Information and data for this issue are based on the following publication and statistics:

Substance Abuse and Mental Health Services Administration. (2001). Summary of findings from the 2000 National Household Survey on Drug Abuse (NHSDA Series: H-13, DHHS Publication No. SMA 01-3549). Rockville, MD: Author.

Also available on-line: http://www.oas.samhsa.gov/nsduh.htm.

Additional Tables 2.24A, 2.24B, 2.95B, 2.102A, 2.102B, 2.106A, and 2.106B available from http://www.oas.samhsa.gov/nhsda/2kdetailedtabs/Vol_1_Part_2/V1P2.htm and

Tables 6.66A, 6.66B, and 6.67B available from http://www.oas.samhsa.gov/nhsda/2kdetailedtabs/Vol_1_Part_4/V1P4.htm.

The NHSDA Report is published periodically by the Office of Applied Studies, Substance Abuse and Mental Health Services Administration (SAMHSA). All material appearing in this report is in the public domain and may be reproduced or copied without permission from SAMHSA. Additional copies of this fact sheet may be downloaded from Other reports from the Office of Applied Studies are also available on-line on the OAS home page: http://www.oas.samhsa.gov

This page was last updated on December 31, 2008.