|
August 9, 2002 |
Youth Marijuana Admissions by Race and Ethnicity |
|
In Brief |
|
|
Marijuana was the primary substance of abuse for more than 126,000
adolescent and college-age admissions reported to the Treatment Episode
Data Set (TEDS) in 1999. Admissions aged 12 to 21, labeled “youth” in
this report, made up 8 percent of all substance abuse treatment
admissions in 1999. Marijuana was the primary substance of abuse for 47
percent of youth treatment admissions compared with 7 percent for all
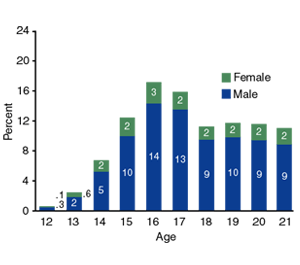
other ages. White In 1999, Whites comprised 66 percent of the U.S. population aged 12 to 21*; about 66 percent of all youth treatment admissions (data not shown) and 59 percent of youth marijuana admissions involved Whites (Figure 1). Marijuana was the primary substance of abuse for 42 percent of all White youth admissions (data not shown). White youth marijuana admissions were 77 percent male and 23 percent female (Figure 2). The percentage of White youth marijuana admissions rose steadily until age 16 and declined rapidly until age 21 for both sexes. However, among this group the average age at admission was about 6 months older for male admissions than for female admissions (data not shown). |
| Figure 1. Youth Marijuana Admissions, by Race/Ethnicity: 1999 | Figure 2. White Youth Marijuana Admissions, by Age and Sex: 1999 |

|

|
|
Black
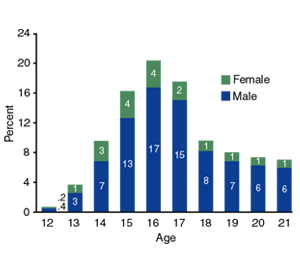
In 1999, Blacks comprised 15 percent of the U.S. population aged 12 to 21*; about 16 percent of all youth treatment admissions (data not shown) and 23 percent of youth marijuana admissions were Black (Figure 1). About 66 percent of all Black youth marijuana admissions were for marijuana (data not shown). Black youth marijuana admissions were 82 percent male and 18 percent female (Figure 3). For both males and females the percentage of admissions rose until age 16, declined until age 18, and leveled off until age 21. Among Black youth marijuana admissions, there were no differences in average age at admission between male and female admissions (data not shown). |
|
||
| Source: 1999 SAMHSA Treatment Episode Data Set (TEDS). |
|
Hispanic In 1999, Hispanics comprised 14 percent of the U.S. population aged 12 to 21*; about 12 percent of all youth treatment admissions (data not shown) and 12 percent of youth marijuana admissions involved Hispanics (Figure 1). Among all Hispanic youth admissions, marijuana was the primary substance of abuse 48 percent of the time (data not shown). Hispanic youth marijuana admissions were 82 percent male and 18 percent female (Figure 4). The percentage of Hispanic youth marijuana admissions rose until age 16, declined rapidly until age 18, and leveled off until age 21. Mexican admissions made up 48 percent of Hispanic youth marijuana admissions and 6 percent of all youth marijuana admissions in 1999 (data not shown). Among all Mexican youth admissions, marijuana was the primary substance of abuse 47 percent of the time. Puerto Rican admissions made up 27 percent of Hispanic youth marijuana admissions in 1999 and 3 percent of all youth marijuana admissions (data not shown). Marijuana was the primary substance of abuse for 52 percent of all Puerto Rican youth admissions in 1999. Puerto Rican youth marijuana admissions had the oldest average age at admission (17.4 years of age) (data not shown). |
| ||
| Source: 1999 SAMHSA Treatment Episode Data Set (TEDS). |
| In 1999, Asians and Pacific Islanders comprised 4 percent of the
U.S. population aged 12 to 21*; more than 1 percent of all youth
treatment admissions (data not shown) and almost 2 percent of youth
marijuana admissions were Asian and Pacific Islander (Figure 1).
Among all Asian and Pacific Islander youth admissions, marijuana was
the primary substance of abuse 49 percent of the time (data not
shown). Asian youth marijuana admissions were 73 percent male and 27 percent female (Figure 5). The percent of Asian youth marijuana admissions rose through age 16 for males and age 15 for females. For both sexes the percentage of admissions declined significantly after age 17. Asian youth marijuana admissions had the youngest average age at admission (16.2 years of age), and the average age at admission was about 8 months younger for female admissions than for male admissions (data not shown). |
|
| Source: 1999 SAMHSA Treatment Episode Data Set (TEDS). |
|
American Indians and Alaska Natives comprised 1 percent of the U.S.
population aged 12 to 21*; about 3 percent of all youth treatment
admissions (data not shown) and 2 percent of youth marijuana admissions
in 1999 involved American Indians and Alaska Natives (Figure 1). Among American Indian and Alaska Native youth marijuana admissions, the percentage of admissions rose until age 16, then declined and leveled off between the ages of 18 and 21 (Figure 6). This group had the lowest percentage of male admissions (69 percent) and conversely the highest percentage of female admissions (31 percent). |
| ||
|
|
|
This page was last updated on December 31, 2008. |