|
Treatment admission rates involving abuse of narcotic painkillers1 increased in publicly funded substance abuse treatment facilities across the nation between 1992 and 2002. In 1992, the treatment admission rate for narcotic painkiller abuse in the United States was 14 admissions per 100,000 persons aged 12 or older.2 By 1997, the admission rate had increased by 12 percent, to 15 per 100,000, and by 2002, it had increased by another 129 percent, to 35 per 100,000.
This report examines narcotic painkiller treatment admission rates per 100,000 persons aged 12 or older at five urbanization levels for 1992, 1997, and 2002. Data are from the Treatment Episode Data Set (TEDS), an annual compilation of data on the 1.9 million annual admissions to publicly funded substance abuse treatment.
U.S. counties and county equivalents were assigned to one of five urbanization levels according to the classification scheme developed by the National Center for Health Statistics (NCHS):3
Large Central Metro-County in a Metropolitan Statistical Area (MSA) of 1 million or more population that contained all or part of the largest central city of the MSA
Large Fringe Metro-County in a large MSA (1 million or more population) that did not contain any part of the largest central city of the MSA
Small Metro-County in an MSA with less than 1 million population
Non-Metro with City-County not in an MSA but with a city of 10,000 or more population
Non-Metro without City-County not in an MSA and without a city of 10,000 or more population
TEDS records indicate where persons entered treatment, not their area of residence. As not all counties have substance abuse treatment facilities, people may seek treatment at an urbanization level different from where they live. Table 1 compares the levels of urbanization of all counties in the United States with that of counties with treatment facilities reporting narcotic painkiller admissions to TEDS.
| Table 1. County Urbanization in the United States and in Counties Reporting Narcotic Painkiller Admissions to TEDS |
|
Number of Counties |
United
States
3,100 |
TEDS
1,700 |
| |
Percent |
|
Large Central Metro |
2% |
4% |
|
Large Fringe Metro |
8% |
12% |
|
Small Metro |
17% |
24% |
|
Non-Metro with City |
15% |
23% |
|
Non-Metro without City |
58% |
37% |
|
| Source: 2002 SAMHSA Treatment Episode Data Set (TEDS). |
| Table 2. Route of Administration of Narcotic Painkillers, by Urbanization: 1992 and 2002 |
| |
Total
United States |
Large Central Metro |
Large Fringe Metro |
Small Metro |
Non-Metro with City |
Non-Metro without City |
| |
Percent |
| 1992 |
|
|
|
|
|
|
|
Oral |
66 |
61 |
74 |
64 |
71 |
76 |
|
Injection |
25 |
25 |
19 |
29 |
21 |
17 |
|
Inhalation |
3 |
4 |
3 |
2 |
3 |
2 |
|
Other |
6 |
10 |
4 |
5 |
5 |
5 |
|
Total |
100 |
100 |
100 |
100 |
100 |
100 |
| 2002 |
|
|
|
|
|
|
|
Oral |
77 |
82 |
83 |
74 |
71 |
69 |
|
Injection |
11 |
7 |
7 |
14 |
15 |
14 |
|
Inhalation |
8 |
5 |
7 |
9 |
9 |
12 |
|
Other |
4 |
6 |
3 |
3 |
5 |
5 |
|
Total |
100 |
100 |
100 |
100 |
100 |
100 |
|
| Source: 2002 SAMHSA Treatment Episode Data Set (TEDS). |
Treatment Admission Rates for Narcotic Painkillers
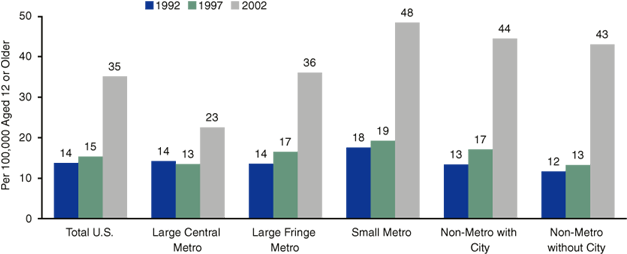
Treatment admission rates for narcotic painkillers increased between 1992 and 2002 in the United States as a whole and at all levels of urbanization (Figure 1). Between 1992 and 2002, the narcotic painkiller treatment admission rate in the United States increased by 155 percent (Figure 2). The increase was smallest in large central metropolitan areas (58 percent), and greatest in the most rural areas, non-metropolitan areas without a city (269 percent).
| Figure 1. Treatment Admissions Involving Narcotic Painkillers per 100,000 Persons Aged 12 or Older, by Urbanization: 1992, 1997, and 2002 |
|
| Source: 2002 SAMHSA Treatment Episode Data Set (TEDS). |
| Figure 2. Increase in Rates of Treatment Admissions Involving Narcotic Painkillers, by Urbanization: 1992-2002 |
|
| Source: 2002 SAMHSA Treatment Episode Data Set (TEDS). |
Route of Administration
The route of administration among narcotic painkiller abusers entering treatment changed between 1992 and 2002. In 1992, 66 percent of admissions for narcotic painkiller abuse took the drugs orally, 25 percent injected them, and 3 percent inhaled them. By 2002, the proportion taking the drugs orally had increased to 77 percent, the proportion injecting had fallen to 11 percent, and the proportion inhaling had increased to 8 percent.
In large central metropolitan areas, the proportion of narcotic painkiller treatment admissions injecting the drugs decreased by 18 percentage points and the proportion taking the drugs orally increased by 21 percentage points. In fringe and small metropolitan areas, the proportions injecting decreased by 12 and 15 percentage points, respectively. In these areas, the proportions taking narcotic painkillers orally and the proportions inhaling them increased by
4 to 10 percentage points. Non-metropolitan areas with cities exhibited a 6-percentage point shift from injection to inhalation.
In the most rural areas (non-metropolitan areas without cities), the proportions of narcotic painkiller treatment admissions who took the drugs orally or injected them both decreased (7 and 3 percentage points, respectively). In these areas, the proportion who inhaled the drugs increased from 2 percent in 1992 to 12 percent in 2002.
End Notes
1 Narcotic painkiller admissions include all admissions reporting primary, secondary, or tertiary abuse of narcotic painkillers such as codeine, hydrocodone, hydromorphone, meperidine, morphine, oxycodone, pentazocine, propoxyphene, and any other drug with morphine-like effects. Admissions involving abuse of heroin and/or methadone, unless reported in addition to abuse of narcotic painkillers, are excluded from this report.
2 States continually review the quality of their data processing. When systematic errors are identified, States may revise or replace historical TEDS data files. While this process represents an improvement in the data system, the historical statistics in this report will differ slightly from those in earlier reports.
3 Eberhardt, M.S., Ingram, D.D., Makuc, D.M., et al. (2001). Urban and Rural Health Chartbook. Health, United States, 2001. Hyattsville, MD: National Center for Health Statistics.
The Drug and Alcohol Services Information System (DASIS) is an integrated data system maintained by the Office of Applied Studies, Substance Abuse and Mental Health Services Administration (SAMHSA). One component of DASIS is the Treatment Episode Data Set (TEDS). TEDS is a compilation of data on the demographic characteristics and substance abuse problems of those admitted for substance abuse treatment. The information comes primarily from facilities that receive some public funding. Information on treatment admissions is routinely collected by State administrative systems and then submitted to SAMHSA in a standard format. Approximately 1.9 million records are included in TEDS each year. TEDS records represent admissions rather than individuals, as a person may be admitted to treatment more than once.
The DASIS Report is prepared by the Office of Applied Studies, SAMHSA; Synectics for Management Decisions, Inc., Arlington, Virginia; and RTI, Research Triangle Park, North Carolina.
Information and data for this issue are based on data reported to TEDS through March 1, 2004.
Access the latest TEDS reports at:
http://www.oas.samhsa.gov/dasis.htm
Access the latest TEDS public use files at:
http://www.oas.samhsa.gov/SAMHDA.htm
Other substance abuse reports are available at:
http://www.oas.samhsa.gov
|
| The DASIS Report is
published periodically by the Office of Applied Studies, Substance Abuse
and Mental Health Services Administration (SAMHSA).
All material appearing in this report is in the public domain and may
be reproduced or copied without permission from SAMHSA.
Additional copies of this report or other reports from the Office of
Applied Studies are available on-line: http://www.oas.samhsa.gov.
Citation of the source is appreciated. |
|
 
This page was last updated on
May 16, 2008.
|
|