
|
| February 4, 2005 |
| In Brief |
|
The 2003 National Survey on Drug Use and Health (NSDUH) asked respondents aged 12 or older to report their illicit drug use, including their nonmedical use of prescription drugs. Nonmedical use is defined as the use of prescription-type drugs not prescribed for the respondent by a physician or used for the experience or feeling they caused. Nonmedical use does not include over-the-counter drugs. Prescription-type drugs are classified into four categories in NSDUH: pain relievers, tranquilizers, stimulants, and sedatives.
Respondents were also asked to report symptoms of dependence or abuse. NSDUH defines dependence on or abuse of illicit drugs or alcohol using criteria specified in the Diagnostic and Statistical Manual of Mental Disorders (DSM-IV),1 including symptoms such as withdrawal, tolerance, use in dangerous situations, trouble with the law, and interference in major obligations at work, school, or home during the past year. This report focuses on 2003 respondents' lifetime and past month nonmedical use of stimulants, as well as their dependence on or abuse of stimulants.2
In 2003, 20.8 million Americans aged 12 or older (8.8 percent of persons in that age group) had used prescription-type stimulants nonmedically at least once in their lifetime. This estimate includes 4.0 percent of 12 to 17 year olds (over 1 million persons), 10.8 percent of persons aged 18 to 25 (3.4 million persons), and 9.0 percent of persons aged 26 or older (16.4 million persons). Males were more likely to report lifetime stimulant use than females (9.8 vs. 7.8 percent). In addition, lifetime stimulant use varied by race/ethnicity (Figure 1).
An estimated 1.2 million persons aged 12 or older used stimulants in the past month in 2003, including 0.9 percent of 12 to 17 year olds, 1.3 percent of 18 to 25 year olds, and 0.3 percent of persons aged 26 or older. While males and females reported similar rates of past month stimulant use, rates varied by race/ethnicity (Figure 1).
| Figure 1. Lifetime and Past Month Nonmedical Use of Stimulants among Persons Aged 12 or Older, by Race/Ethnicity: 2003 | Figure 2. Lifetime Nonmedical Use of Specific Stimulant Drugs among Persons Aged 12 or Older: 2003 |
 |
 |
In 2003, an estimated 378,000 persons in the United States met the diagnostic criteria for dependence on or abuse of stimulants in the past year. Past year dependence on or abuse of stimulants was most prevalent among persons aged 12 to 17 and those aged 18 to 25 (0.4 percent of each). Persons aged 26 or older had a significantly lower rate of dependence on or abuse of stimulants (0.1 percent). Dependence on or abuse of stimulants was equally likely among males and females (0.2 and 0.1 percent, respectively).
NSDUH asks respondents about their lifetime nonmedical use of different types of stimulants, as well as other stimulants that may not fall within these categories. The class of stimulants most frequently reported was methamphetamine3 (5.2 percent of the population; 12.3 million persons) (Figure 2). Lifetime use of prescription diet pills was reported by 3.6 percent of persons aged 12 or older (8.7 million persons). Lifetime use of Ritalin® or methylphenidate was reported by 1.8 percent of persons aged 12 or older (4.2 million persons), and lifetime use of Dexedrine® was reported by 1.1 percent (2.6 million persons).
Use of methamphetamine, the most frequently reported stimulant among the general population, varied by age group. Persons aged 18 to 25 and those aged 26 or older were significantly more likely than youths aged 12 to 17 to have used methamphetamine in their lifetime (5.2 and 5.7 percent vs. 1.3 percent, respectively). Past month methamphetamine use was significantly more common among persons aged 18 to 25 (0.6 percent) than among youths aged 12 to 17 (0.3 percent) or those aged 26 or older (0.2 percent).
| Figure 3. Past Year Dependence/Abuse and Past Month Nonmedical Use of Stimulants among Persons Aged 12 or Older, by Geographic Region: 2003 |
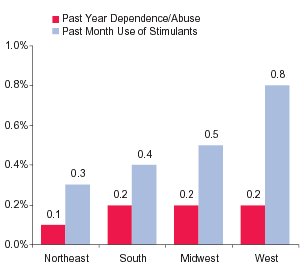 |
Past month use of stimulants varied by geographic region.4 Past month stimulant use was highest in the West, significantly higher than in the Midwest, Northeast, or South (Figure 3). However, past year dependence on or abuse of stimulants did not vary by region.
Past month use of methamphetamine was also significantly higher in the west (0.6 percent) than in the Midwest (0.2 percent), South (0.2 percent), or Northeast (less than 0.1 percent).
* Past month nonmedical use of stimulants could not be estimated for Native Hawaiians/Pacific Islanders due to small sample size.
Source: SAMHSA 2003 NSDUH.
| The National Survey on Drug Use and Health (NSDUH) is an annual survey sponsored by the Substance Abuse and Mental Health Services Administration (SAMHSA). Prior to 2002, this survey was called the National Household Survey on Drug Abuse (NHSDA). The 2003 data are based on information obtained from 67,784 respondents aged 12 or older. The survey collects data by administering questionnaires to a representative sample of the population through face-to-face interviews at their place of residence.
The NSDUH Report is prepared by the Office of Applied Studies (OAS), SAMHSA, and by RTI International in Research Triangle Park, North Carolina. (RTI International is a trade name of Research Triangle Institute.) Information and data for this issue are based on the following publication and statistics: Office of Applied Studies. (2003). Results from the 2002 National Survey on Drug Use and Health: National findings (DHHS Publication No. SMA 04–3964, NSDUH Series H–25). Rockville, MD: Substance Abuse and Mental Health Services Administration. Also available online: http://www.oas.samhsa.gov. Because of improvements and modifications to the 2002 NSDUH, estimates from the 2002 or 2003 survey should not be compared with estimates from the 2001 or earlier versions of the survey to examine changes over time.
|
The NSDUH Report (formerly The NHSDA Report) is published periodically by the Office of Applied Studies, Substance Abuse & Mental Health Services Administration (SAMHSA). All material appearing in this report is in the public domain and may be reproduced or copied without permission from SAMHSA. Additional copies of this report or other reports from the Office of Applied Studies are available on-line: http://www.oas.samhsa.gov. Citation of the source is appreciated. For questions about this report please e-mail: shortreports@samhsa.hhs.gov.
This page was last updated on May 15, 2008. |