
| |
| Issue 24 | 2006 |
|
In 2003-2004, there were 1.5 million youths aged 12 to 17 (6.1 percent of youths) who were classified as needing treatment for alcohol use. The need for alcohol use treatment increased with increasing age (Table 1). Among racial/ethnic groups, American Indian or Alaska Native youths had the highest rate of alcohol use treatment need (14.1 percent). There were no differences in the need for alcohol use treatment by gender or family income.
| Demographic Characteristics | Alcohol Use Treatment Need (Percent) |
Illicit Drug Use Treatment Need (Percent) |
|---|---|---|
| Gender | ||
| Male | 6.0 | 5.5 |
| Female | 6.3 | 5.3 |
| Age Group | ||
| 12 or 13 | 1.2 | 1.4 |
| 14 or 15 | 5.3 | 5.4 |
| 16 or 17 | 12.0 | 9.5 |
| Race/Ethnicity* | ||
| White, non-Hispanic | 6.9 | 5.8 |
| Black or African American, non-Hispanic |
2.8 | 3.8 |
| American Indian or Alaska Native, non-Hispanic |
14.1 | 11.8 |
| Native Hawaiian or Other Pacific Islander, non-Hispanic |
5.4 | ** |
| Asian, non-Hispanic | 2.9 | 2.3 |
| Two or More Races, non-Hispanic | 9.7 | 9.5 |
| Hispanic or Latino | 6.1 | 5.6 |
| Family Income | ||
| Less Than $20,000 | 6.0 | 6.2 |
| $20,000-$49,999 | 6.0 | 5.8 |
| $50,000-$74,999 | 6.3 | 5.2 |
| $75,000 or Higher | 6.2 | 4.7 |
| Source: SAMHSA, 2003 and 2004 NSDUHs. |
Of the youths who were classified as needing alcohol use treatment, 7.2 percent (about 111,000 youths) received specialty treatment for alcohol use in the past year. Males who were classified as needing alcohol use treatment were more likely to have received specialty treatment than females (Table 2). Of the youths who were classified as needing alcohol use treatment, 90.6 percent did not receive treatment and did not perceive the need for treatment (Figure 1). Only 2.2 percent did not receive treatment but did perceive an unmet treatment need.
| Demographic Characteristics | Received Alcohol Use Treatment (Percent) |
Received Illicit Drug Use Treatment (Percent) |
|---|---|---|
| Gender | ||
| Male | 8.8 | 10.2 |
| Female | 5.7 | 7.9 |
| Age Group | ||
| 12 or 13 | 4.0 | 3.5 |
| 14 or 15 | 6.5 | 8.3 |
| 16 or 17 | 7.9 | 10.4 |
| Race/Ethnicity* | ||
| White, non-Hispanic | 8.0 | 10.5 |
| Black or African American, non-Hispanic |
7.8 | 7.2 |
| American Indian or Alaska Native, non-Hispanic |
** | ** |
| Native Hawaiian or Other Pacific Islander, non-Hispanic |
** | ** |
| Asian, non-Hispanic | ** | ** |
| Two or More Races, non-Hispanic | ** | ** |
| Hispanic or Latino | 4.0 | 6.1 |
| Family Income | ||
| Less Than $20,000 | 9.7 | 9.6 |
| $20,000-$49,999 | 8.2 | 11.0 |
| $50,000-$74,999 | 5.4 | 6.2 |
| $75,000 or Higher | 5.7 | 7.9 |
| Source: SAMHSA, 2003 and 2004 NSDUHs. |
 |
| Percent | |
|---|---|
| Received Alcohol Treatment | 7.2 |
| Did Not Receive Alcohol Treatment, But Perceived a Need for Treatment | 2.2 |
| Did Not Receive Alcohol Treatment and Did Not Perceive a Need for Treatment | 90.6 |
| Source: SAMHSA, 2003 and 2004 NSDUHs. |
In 2003-2004, there were 1.4 million youths aged 12 to 17 (5.4 percent of youths) who were classified as needing treatment for illicit drug use. More youths aged 16 or 17 were classified as needing treatment for illicit drug use compared with youths aged 14 or 15 and those aged 12 or 13. Among racial/ethnic groups, American Indian or Alaska Native youths had the highest rate of illicit drug use treatment need (11.8 percent) (Table 1). Youth in families with an income of less than $20,000 per year and $20,000 to $49,999 per year were more likely to have been classified as being in need of illicit drug treatment than youth from families with incomes of $75,000 or more. There was no difference in the need for illicit drug use treatment by gender.
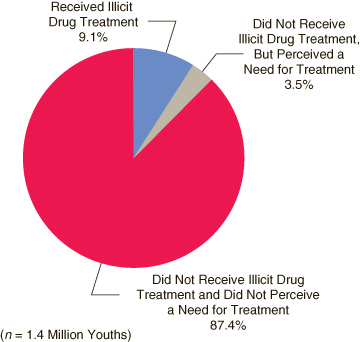
Of the youths who were classified as needing illicit drug use treatment, 9.1 percent (about 124,000 youths) had received specialty treatment for illicit drug use in the past year. Youths aged 12 or 13 who were classified as needing illicit drug use treatment were less likely to have received specialty treatment than youths aged 14 or 15 or those aged 16 or 17 (Table 2). Of the youths who were classified as needing illicit drug use treatment, 87.4 percent did not receive treatment and did not perceive the need for treatment (Figure 2). Only 3.5 percent did not receive treatment but did perceive an unmet treatment need.
 |
| Percent | |
|---|---|
| Received Illicit Drug Treatment | 9.1 |
| Did Not Receive Illicit Drug Treatment, But Perceived a Need for Treatment | 3.5 |
| Did Not Receive Illicit Drug Treatment and Did Not Perceive a Need for Treatment | 87.4 |
| Source: SAMHSA, 2003 and 2004 NSDUHs. |
| The National Survey on Drug Use and Health (NSDUH) is an annual survey sponsored by the Substance Abuse and Mental Health Services Administration (SAMHSA). Prior to 2002, this survey was called the National Household Survey on Drug Abuse (NHSDA). The 2003 and 2004 data are based on information obtained from 44,966 persons aged 12 to 17, of whom 2,857 were classified as needing treatment for alcohol use and 2,506 were classified as needing treatment for illicit drug use. The survey collects data by administering questionnaires to a representative sample of the population through face-to-face interviews at their place of residence. The NSDUH Report is prepared by the Office of Applied Studies (OAS), SAMHSA, and by RTI International in Research Triangle Park, North Carolina. (RTI International is a trade name of Research Triangle Institute.) Information on NSDUH used in compiling data for this issue is available in the following publications: Office of Applied Studies. (2005). Results from the 2004 National Survey on Drug Use and Health: National findings (DHHS Publication No. SMA 05-4062, NSDUH Series H-28). Rockville, MD: Substance Abuse and Mental Health Services Administration. Office of Applied Studies. (2004). Results from the 2003 National Survey on Drug Use and Health: National findings (DHHS Publication No. SMA 04-3964, NSDUH Series H-25). Rockville, MD: Substance Abuse and Mental Health Services Administration. Also available online: http://www.oas.samhsa.gov. Because of improvements and modifications to the 2002 NSDUH, estimates from the 2002, 2003, and 2004 surveys should not be compared with estimates from the 2001 or earlier versions of the survey to examine changes over time. |
| The NSDUH Report (formerly The NHSDA Report) is published periodically by the Office of Applied Studies, Substance Abuse and Mental Health Services Administration (SAMHSA). All material appearing in this report is in the public domain and may be reproduced or copied without permission from SAMHSA. Additional copies of this report or other reports from the Office of Applied Studies are available online: http://www.oas.samhsa.gov. Citation of the source is appreciated. For questions about this report, please e-mail: shortreports@samhsa.hhs.gov. |
|
This page was last updated on December 30, 2008. |