
September 13, 2007
|
September 13, 2007 |
|
Cocaine, one of the oldest known drugs, is a powerfully addictive stimulant,1 which has been inhaled, smoked, injected, and ingested orally. The predominant route of administration (method of use) has changed over time. For much of the 20th century, inhaling (or “snorting”) cocaine in its powder form was the most common route of administration.2 However, in the early 1980s, a potent, smokeable form of cocaine known as “crack” was developed.3 Since smoking crack cocaine was less expensive and also provided a more immediate and intense effect than inhaling powder cocaine,4 crack rapidly became the most commonly used form of the drug in the United States.5
Trends in admissions to substance abuse treatment for cocaine abuse—including admissions by route of administration6—can be monitored with the Treatment Episode Data Set (TEDS). TEDS is an annual compilation of data on the demographic characteristics and substance abuse problems of those admitted to substance abuse treatment, primarily at facilities that receive some public funding.7 TEDS records represent admissions rather than individuals, as a person may be admitted to substance abuse treatment more than once during a single year. This report examines admissions to substance abuse treatment in which cocaine was the primary substance of abuse.8 Specifically, this report compares trends in admissions to substance abuse treatment for two routes of cocaine administration, smoked and inhaled, between 1995 and 2005.
Admissions to substance abuse treatment in which cocaine was the primary substance of abuse decreased from 1995 to 2005. The number of admissions decreased from 278,400 in 1995 (17 percent of all admissions) to 256,500 in 2005 (14 percent of all admissions).
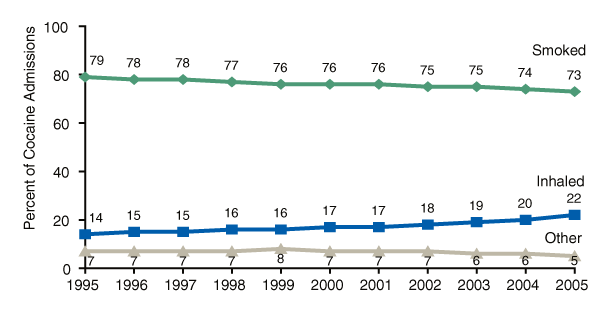
Among admissions to substance abuse treatment in which cocaine was the primary substance of abuse, smoking was the most frequent route of administration of the drug in each year from 1995 to 2005. The proportion of primary cocaine admissions who smoked the drug, however, declined during this period from 79 percent of admissions for primary cocaine abuse in 1995 to 73 percent in 2005 (Figure 1).
Inhalation was consistently the second most frequent route of administration for cocaine from 1995 to 2005. In contrast to smoking, the proportion of primary cocaine admissions who inhaled the drug has increased since 1995, from 14 percent of admissions for primary cocaine abuse in 1995 to 22 percent in 2005.
 |
Source: 2005 SAMHSA Treatment Episode Data Set (TEDS). |
| Year | Smoked | Inhaled | Other |
|---|---|---|---|
| 1995 | 79% | 14% | 7% |
| 1996 | 78% | 15% | 7% |
| 1997 | 78% | 15% | 7% |
| 1998 | 77% | 16% | 7% |
| 1999 | 76% | 16% | 8% |
| 2000 | 76% | 17% | 7% |
| 2001 | 76% | 17% | 7% |
| 2002 | 75% | 18% | 7% |
| 2003 | 75% | 19% | 6% |
| 2004 | 74% | 20% | 6% |
| 2005 | 73% | 22% | 5% |
Source: 2005 SAMHSA Treatment Episode Data Set (TEDS). |
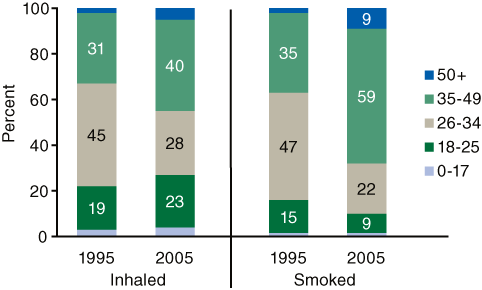
The age at admission to substance abuse treatment for primary use of smoked cocaine increased between 1995 and 2005. In 1995, 63 percent of these admissions were younger than 35; by 2005, only 32 percent of these admissions were in this age group (Figure 2). Admissions in the older age groups increased correspondingly: the proportion of admissions for primary use of smoked cocaine aged 35 to 49 increased from 35 percent in 1995 to 59 percent in 2005; the proportion of admissions for primary use of smoked cocaine aged 50 or older increased from 2 percent in 1995 to 9 percent in 2005.
In general, trends in the age at admission to substance abuse treatment for primary use of inhaled cocaine were similar to those for smoked cocaine admissions. One exception, however, was that the proportion of admissions for primary use of inhaled cocaine aged 18 to 25 years old increased from 1995 to 2005 (19 to 23 percent).
In addition to the general shifts in the proportion of admissions from younger to older age groups, there were also increases in the percentage of admissions who reported using cocaine for more than 10 years. The proportion of smoked cocaine admissions using the drug for more than 10 years increased from 32 percent in 1995 to 63 percent in 2005; the proportion of inhaled cocaine admissions using the drug for more than 10 years increased from 41 percent in 1995 to 49 percent in 2005.
 |
Source: 2005 SAMHSA Treatment Episode Data Set (TEDS). |
| Age At Admission | Inhaled | Smoked | ||
|---|---|---|---|---|
| 1995 | 2005 | 1995 | 2005 | |
| 0-17 | 3% | 4% | 1% | 1% |
| 18-25 | 19% | 23% | 15% | 9% |
| 26-34 | 45% | 28% | 47% | 22% |
| 35-49 | 31% | 40% | 35% | 59% |
| 50+ | 2% | 5% | 2% | 9% |
Source: 2005 SAMHSA Treatment Episode Data Set (TEDS). |
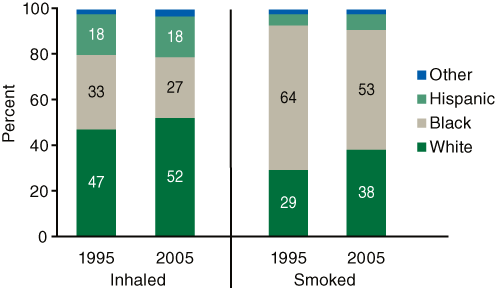
Among both smoked and inhaled cocaine admissions, there was an increase in the proportion of admissions who were White and a decrease in the proportion who were Black between 1995 and 2005 (Figure 3). However, there was little or no change in the proportion of admissions who were Hispanic for either smoked or inhaled cocaine admissions.
In both 1995 and 2005, the proportion of admissions for primary use of smoked cocaine who were Black was substantially higher than the proportion of admissions who were White. A converse relationship was found for admissions for primary use of inhaled cocaine.
 |
Source: 2005 SAMHSA Treatment Episode Data Set (TEDS). |
| Race Ethnicity | Inhaled | Smoked | ||
|---|---|---|---|---|
| 1995 | 2005 | 1995 | 2005 | |
| White | 47% | 52% | 29% | 38% |
| Black | 33% | 27% | 64% | 53% |
| Hispanic | 18% | 18% | 5% | 7% |
| Other | 2% | 3% | 2% | 2% |
Source: 2005 SAMHSA Treatment Episode Data Set (TEDS). |
Among admissions to substance abuse treatment for primary use of smoked cocaine, the proportion of admissions who were employed full time9 decreased between 1995 and 2005 (16 vs. 12 percent); this decrease was matched by a corresponding increase in the proportion of admissions “not in the labor force” from 41 percent to 45 percent (Figure 4). The proportion of admissions who were employed part time and who were unemployed remained stable.
Trends in employment status were somewhat different, however, between smoked and inhaled cocaine admissions. Similar to smoked cocaine admissions, the proportion of inhaled cocaine admissions who were employed full time decreased between 1995 and 2005 (31 vs. 25 percent); however, for inhaled cocaine admissions, this decrease was matched by a corresponding increase in the proportion of admissions who were unemployed (26 vs. 32 percent).
 |
Source: 2005 SAMHSA Treatment Episode Data Set (TEDS). |
| Employment Status | Inhaled | Smoked | ||
|---|---|---|---|---|
| 1995 | 2005 | 1995 | 2005 | |
| Full Time | 31% | 25% | 16% | 12% |
| Part Time | 7% | 7% | 5% | 5% |
| Unemployed | 26% | 32% | 38% | 38% |
| Not in Labor Force | 36% | 36% | 41% | 45% |
Source: 2005 SAMHSA Treatment Episode Data Set (TEDS). |
1 National Institute on Drug Abuse (2005, February 5). Research Report Series - Cocaine Abuse and Addiction. Retrieved July 26, 2007, from http://www.nida.nih.gov/ResearchReports/Cocaine/cocaine2.html
2 Substance Abuse and Mental Health Services Administration, Office of Applied Studies. (2006). Results from the 2005 National Survey on Drug Use and Health: National findings (NSDUH Series H-30, DHHS Publication No. SMA 06-4194). Rockville, MD, tables G.3, G.28.
3 Alcohol, Drug Abuse, and Mental Health Administration. (1977). Cocaine: 1977 (DHEW Publication No. ADM 77-471). Washington, DC: U.S. Government Printing Office.
4 National Institute on Drug Abuse, op. cit.
5 Hamid, A. (1992). The developmental cycle of a drug epidemic: The cocaine smoking epidemic of 1981-1991. Journal of Psychoactive Drugs, 24(4), 337-48.
6 The route of administration is the method by which the substance of abuse is taken. The categories are oral, smoking, inhalation, injection (IV or intramuscular), and other.
7 In 2005, TEDS collected data on 1.8 million admissions to substance abuse treatment facilities. Four States and jurisdictions (AK, DC, NM, and WY) did not submit data for 2005.
8 The primary substance of abuse is the main substance reported at the time of admission.
9 Analysis of employment status includes admissions aged 16 or older.
Substance Abuse and Mental Health Services Administration, Office of Applied Studies. (September 13, 2007). The DASIS Report: Cocaine Route of Administration Trends: 1995-2005. Rockville, MD.
| The Drug and
Alcohol Services Information System (DASIS) is an integrated data
system maintained by the Office of Applied Studies, Substance Abuse and
Mental Health Services Administration (SAMHSA). One component of DASIS
is the Treatment Episode Data Set (TEDS). TEDS is a compilation of data
on the demographic characteristics and substance abuse problems of
those admitted for substance abuse treatment. The information comes
primarily from facilities that receive some public funding. Information
on treatment admissions is routinely collected by State administrative
systems and then submitted to SAMHSA in a standard format. TEDS records
represent admissions rather than individuals, as a person may be
admitted to treatment more than once. State admission data are reported
to TEDS by the Single State Agencies (SSAs) for substance abuse
treatment. There are significant differences among State data
collection systems. Sources of State variation include completeness of
reporting, facilities reporting TEDS data, clients included, and
treatment resources available. See the annual TEDS reports for details.
Approximately 1.8 million records are included in TEDS each year. The DASIS Report is prepared by the Office of Applied Studies, SAMHSA; Synectics for Management Decisions, Inc., Arlington, Virginia; and by RTI International in Research Triangle Park, North Carolina (RTI International is a trade name of Research Triangle Institute). Information and data for this issue are based on data reported to TEDS through February 1, 2006. Access the latest TEDS reports
at: |
| The DASIS Report is published periodically by the Office of Applied Studies, Substance Abuse and Mental Health Services Administration (SAMHSA). All material appearing in this report is in the public domain and may be reproduced or copied without permission from SAMHSA. Additional copies of this report or other reports from the Office of Applied Studies are available on-line: http://www.oas.samhsa.gov. Citation of the source is appreciated. For questions about this report please e-mail: shortreports@samhsa.hhs.gov |
|
This page was last updated on December 30, 2008. |