
|
| August 28, 2008 |
|
In 2006, a majority (53.4 percent) of current alcohol users aged 12 to 20 drank at someone else's home the last time they used alcohol, and another 30.3 percent drank in their own home. This overall pattern of last using alcohol in their own home or at someone else's home held for drinkers at each age from 13 to 20 (Figure 1).5 More than 60 percent of drinkers aged 16 or 17 used alcohol in someone else's home the last time they drank. About 36 percent or more of drinkers aged 13, 14, and 20 last used alcohol in their own homes. In addition, 10.0 percent of 13-year-old drinkers last consumed alcohol in public places (such as a park, a beach, or a parking lot).
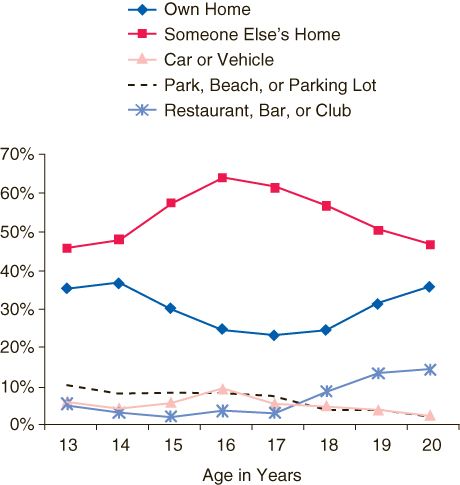 |
| Location | 13 | 14 | 15 | 16 | 17 | 18 | 19 | 20 |
|---|---|---|---|---|---|---|---|---|
| Own Home | 36.1% | 37.4% | 30.9% | 24.9% | 23.8% | 25.2% | 32.0% | 36.5% |
| Someone Else's Home | 45.3% | 47.6% | 57.0% | 63.6% | 61.0% | 56.3% | 49.9% | 46.2% |
| Car or Vehicle | 6.9% | 5.1% | 6.6% | 10.1% | 6.3% | 5.7% | 4.6% | 3.2% |
| Park, Beach, or Parking Lot | 10.0% | 7.9% | 8.0% | 8.1% | 7.1% | 3.4% | 3.4% | 1.9% |
| Restaurant, Bar, or Club | 6.1% | 3.7% | 2.8% | 4.2% | 3.7% | 9.3% | 14.1% | 15.0% |
| Source: SAMHSA, 2006 NSDUH. |
The percentage of underage alcohol users who had their most recent drink in a car or other vehicle peaked at 10.1 percent at age 16. An estimated 15.0 percent of those aged 20 last drank in a restaurant, bar, or club. Approximately 7 to 10 percent of alcohol users aged 13 to 17 last drank in public places, with the percentages decreasing to fewer than 4 percent of drinkers aged 18 to older. In contrast, most recent use of alcohol in a restaurant, bar, or club started to increase at age 18 and was at its highest point at age 20.
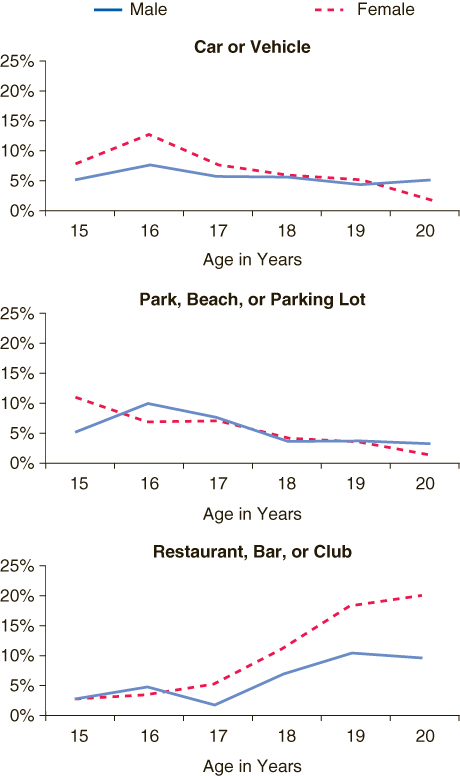
Among male alcohol users, the percentage reporting that they drank most recently in a car or other vehicle did not differ significantly by age between ages 15 and 20,6 but it did differ for females (Figure 2). An estimated 12.8 percent of female alcohol users who were aged 16 last drank alcohol in a car or other motor vehicle, a rate that was 8 times greater than the rate for female drinkers who were aged 20 (1.6 percent). At age 16, 7.3 percent of male current drinkers had their last drink in a car or other vehicle.
 |
| Car or Other Vehicle | ||||||
|---|---|---|---|---|---|---|
| Gender | 15 | 16 | 17 | 18 | 19 | 20 |
| Male | 4.9% | 7.3% | 5.3% | 5.4% | 4.2% | 4.7% |
| Female | 8.0% | 12.8% | 7.5% | 6.1% | 5.0% | 1.6% |
| Park, Beach, or Parking Lot | ||||||
| Gender | 15 | 16 | 17 | 18 | 19 | 20 |
| Male | 5.0% | 9.9% | 7.5% | 3.1% | 3.3% | 2.8% |
| Female | 10.6% | 6.5% | 6.7% | 3.9% | 3.5% | 0.9% |
| Restaurant, Bar, or Club | ||||||
| Gender | 15 | 16 | 17 | 18 | 19 | 20 |
| Male | 2.8% | 4.9% | 2.2% | 7.3% | 10.8% | 10.2% |
| Female | 2.9% | 3.5% | 5.6% | 12.2% | 18.3% | 20.0% |
| Source: SAMHSA, 2006 NSDUH. |
Among 15-year-old drinkers, females were twice as likely as males to have last used alcohol in a public place, such as a park, beach, or parking lot (10.6 vs. 5.0 percent). Among males, alcohol consumption in public places peaked at age 16 and then declined. Among females, alcohol consumption in public places declined after age 15.
The proportion of underage current drinkers who consumed their last alcohol in a restaurant, bar, or club generally increased with age. Starting at age 17, female drinkers were more likely than their male counterparts to have consumed alcohol in one of these locations. Among 20-year-old current drinkers, 20.0 percent of females drank in a restaurant, bar, or club the last time they used alcohol compared with 10.2 percent of males.
Among drinkers aged 18 to 20, those who were living with a parent or similar relative were more likely than those who were not living with a parental relative to have most recently used alcohol in someone else's home (55.4 and 43.1 percent, respectively) (Table 1). This pattern was more pronounced for drinkers in this age group who were not full-time college students (54.4 percent of those living with a parental relative vs. 31.7 percent of those who were not). However, more than half of underage drinkers who were full-time college students last drank alcohol in someone else's home regardless of whether they were living with a parental relative.
| College Enrollment Status/ Parental Living Situation |
Location of Most Recent Alcohol Use | |||
|---|---|---|---|---|
| Home | Someone Else's Home | |||
| % | SE+ | % | SE+ | |
| Total Aged 18 to 20++ | ||||
| Living with a Parental Relative | 24.3% | 1.07% | 55.4% | 1.29% |
| Not Living with a Parental Relative | 42.9% | 1.90% | 43.1% | 1.92% |
| Full-Time College Student | ||||
| Living with a Parental Relative | 21.2% | 1.49% | 56.8% | 2.03% |
| Not Living with a Parental Relative | 33.5% | 2.28% | 50.7% | 2.33% |
| Other++ | ||||
| Living with a Parental Relative | 26.6% | 1.54% | 54.4% | 1.72% |
| Not Living with a Parental Relative | 56.9% | 2.55% | 31.7% | 2.47% |
| Source: SAMHSA, 2006 NSDUH. |
Underage alcohol use poses important public health and public safety risks. Knowing the locations where this behavior is most likely to occur can help parents talk with their teenagers more effectively about the dangers of alcohol use and alert parents to times when they need to exercise greater monitoring and supervision. These data also provide prevention specialists with new information to help guide program development or modify existing prevention activities in their communities.
| The National Survey on Drug Use and Health (NSDUH) is an annual survey sponsored by the Substance Abuse and Mental Health Services Administration (SAMHSA). The 2006 data used in this report are based on information obtained from 31,320 persons aged 12 to 20. The survey collects data by administering questionnaires to a representative sample of the population through face-to-face interviews at their place of residence. The NSDUH Report is prepared by the Office of Applied Studies (OAS), SAMHSA, and by RTI International in Research Triangle Park, North Carolina. (RTI International is a trade name of Research Triangle Institute.) Information on the most recent NSDUH is available in the following publication: Office of Applied Studies. (2007). Results from the 2006 National Survey on Drug Use and Health: National findings (DHHS Publication No. SMA 07-4293, NSDUH Series H-32). Rockville, MD: Substance Abuse and Mental Health Services Administration. Also available online: http://oas.samhsa.gov. Because of improvements and modifications to the 2002 NSDUH, estimates from the 2002 through 2006 surveys should not be compared with estimates from the 2001 or earlier versions of the survey to examine changes over time. |
| The NSDUH Report is published periodically by the Office of Applied Studies, Substance Abuse and Mental Health Services Administration (SAMHSA). All material appearing in this report is in the public domain and may be reproduced or copied without permission from SAMHSA. Additional copies of this report or other reports from the Office of Applied Studies are available online: http://oas.samhsa.gov. Citation of the source is appreciated. For questions about this report, please e-mail: shortreports@samhsa.hhs.gov.
NSDUH_112 |
This page was last updated on December 30, 2008. |