 |
| March 31, 2008 |
Quantity and Frequency of Alcohol Use among Underage Drinkers
In Brief
- Combined 2005 and 2006 data indicate that an annual average of 28.3 percent of persons aged 12 to 20 in the United States (an estimated 10.8 million persons annually) drank alcohol in the past month
- Past month alcohol users aged 12 to 20 drank on an average of 5.9 days in the past month and consumed an average of 4.9 drinks per day on the days they drank in the past month
- Underage drinkers aged 12 to 20 consumed, on average, more drinks per day on the days they drank in the past month than persons aged 21 or older (4.9 vs. 2.8 drinks)
|
In 2006, a majority (53.9 percent) of American adolescents and young adults aged 12 to 20 had used an alcoholic beverage at least once in their lifetime.1 Young people aged 12 to 20 consumed approximately 11.2 percent of the alcoholic drinks consumed in the United States in the past month by persons aged 12 or older.2 Research shows that underage drinkers tend to consume more alcohol per occasion than those over the legal minimum drinking age of 21.3 Studies also have linked early drinking to heavy alcohol consumption and alcohol-related problems in adulthood.4,5 For example, in 2006, 16.3 percent of adults aged 21 or older who had first used alcohol before the age of 15 met the criteria for alcohol dependence or abuse in the past year compared with 2.4 percent of adults who first used alcohol at age 21 or older.6 Research also shows that early initiation of alcohol use is associated with higher likelihood of involvement in violent behaviors, suicide attempts, unprotected sexual intercourse, and multiple sex partners.7,8
The National Survey on Drug Use and Health (NSDUH) asks persons aged 12 or older to report the frequency and quantity of their alcohol use during the 30 days prior to the interview. Respondents who drank alcohol in the past 30 days also are asked for the number of days they consumed alcohol in the past month and the average number of drinks consumed per day on the days they drank.9
This report focuses on the frequency and quantity of past month alcohol use among underage drinkers (i.e., persons aged 12 to 20 who consume alcohol). Comparisons of the quantity and frequency of alcohol use in the past month also are made between underage drinkers and drinkers aged 21 or older. All findings presented in this report are based on combined 2005 and 2006 NSDUH data.
Past Month Alcohol Use
Combined 2005 and 2006 data indicate that an annual average of 28.3 percent of persons aged 12 to 20 in the United States (an estimated 10.8 million persons annually) drank alcohol in the past month. Rates of past month alcohol use among persons aged 12 to 20 varied by demographic characteristics. Young adults aged 18 to 20 were 3 times as likely as youths aged 12 to 17 to have used alcohol in the past month (51.4 vs. 16.6 percent) (Table 1). Underage males were more likely than their female counterparts to have drunk alcohol in the past month (29.1 vs. 27.5 percent). Across racial/ethnic groups, the rate of past month alcohol use among persons aged 12 to 20 ranged from 17.6 percent among Asians to 32.3 percent among whites.10
Table 1. Percentages of Past Month Alcohol Use among Persons Aged 12 to 20, by Demographic Characteristics: 2005-2006
| Demographic Characteristic |
Past Month Alcohol Use |
| % |
SE* |
| Total Aged 12 to 20 |
28.3% |
0.31 |
| Age Group |
|
|
| 12 to 17 |
16.6% |
0.23 |
| 18 to 20 |
51.4% |
0.58 |
| Gender |
|
|
| Male |
29.1% |
0.39 |
| Female |
27.5% |
0.40 |
| Race/Ethnicity** |
|
|
| White |
32.3% |
0.39 |
| Black or African American |
18.8% |
0.58 |
| American Indian or Alaska Native |
26.4% |
2.43 |
| Native Hawaiian or Other Pacific Islander |
18.0% |
3.76 |
| Asian |
17.6% |
1.59 |
| Two or More Races |
25.7% |
1.82 |
| Hispanic or Latino |
25.6% |
0.69 |
| Source: SAMHSA, 2005 and 2006 NSDUHs. |
Number of Days of Alcohol Use in the Past Month
Past month alcohol users aged 12 to 20 drank on an average of 5.9 days in the past month (Figure 1). Underage drinkers aged 18 to 20 consumed alcohol on more days in the past month than those aged 12 to 17 (6.7 vs. 4.6 days). Male underage drinkers used alcohol on more days in the past month than their female counterparts (6.6 vs. 5.1 days). The number of days of alcohol use in the past month varied by race/ethnicity, ranging from an average of 4.2 days among Asians to an average of 8.3 days in the past month among Native Hawaiians or Other Pacific Islanders.
Figure 1. Average Number of Days of Alcohol Use in the Past Month among Past Month Alcohol Users Aged 12 to 20, by Demographic Characteristics: 2005-2006
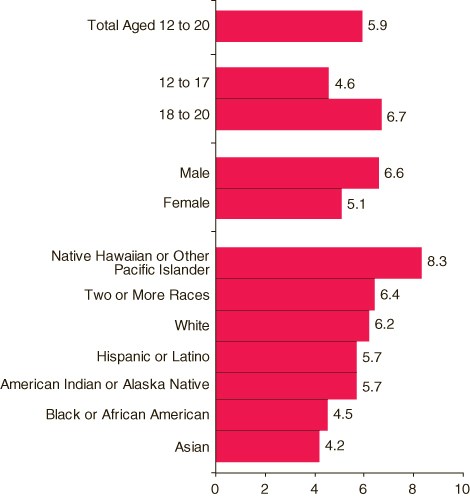 |
Figure 1 Table. Average Number of Days of Alcohol Use in the Past Month among Past Month Alcohol Users Aged 12 to 20, by Demographic Characteristics: 2005-2006
| Demographic Characteristics |
Number of Days |
| Total Aged 12 to 20 |
5.9 |
| Aged 12 to 17 |
4.6 |
| Aged 18 to 20 |
6.7 |
| Male |
6.6 |
| Female |
5.1 |
| Native Hawaiian or Other Pacific Islander |
8.3 |
| Two or More Races |
6.4 |
| White |
6.2 |
| Hispanic or Latino |
5.7 |
| American Indian or Alaska Native |
5.7 |
| Black or African American |
4.5 |
| Asian |
4.2 |
| Source: SAMHSA, 2005 and 2006 NSDUHs. |
Number of Drinks per Day in the Past Month
Past month alcohol users aged 12 to 20 consumed an average of 4.9 drinks per day on the days they drank in the past month (Figure 2). The average number of drinks consumed per day varied by demographic characteristics. Past month alcohol users aged 18 to 20 averaged more drinks per day than their counterparts aged 12 to 17 (5.2 vs. 4.5 drinks). Among underage past month alcohol users, males consumed an average of 5.8 drinks per day on the days they drank in the past month, and females consumed an average of 4.0 drinks per day on the days they drank. Among underage past month drinkers, the average number of drinks consumed per day ranged from 2.8 drinks per day among blacks to 6.4 drinks per day among Native Hawaiians or Other Pacific Islanders.
Figure 2. Average Number of Drinks Consumed per Day on the Days Used Alcohol in the Past Month among Past Month Alcohol Users Aged 12 to 20, by Demographic Characteristics: 2005-2006
 |
Figure 2 Table. Average Number of Drinks Consumed per Day on the Days Used Alcohol in the Past Month among Past Month Alcohol Users Aged 12 to 20, by Demographic Characteristics: 2005-2006
| Demographic Characteristics |
Number of Drinks |
| Total Aged 12 to 20 |
4.9 |
| Aged 12 to 17 |
4.5 |
| Aged 18 to 20 |
5.2 |
| Male |
5.8 |
| Female |
4.0 |
| Native Hawaiian or Other Pacific Islander |
6.4 |
| American Indian or Alaska Native |
5.4 |
| White |
5.3 |
| Two or More Races |
5.0 |
| Hispanic or Latino |
4.9 |
| Asian |
3.4 |
| Black or African American |
2.8 |
| Source: SAMHSA, 2005 and 2006 NSDUHs. |
Underage Drinkers Versus Drinkers of Legal Age
Among past month alcohol users, drinkers aged 21 or older averaged more days of alcohol consumption in the past month than underage drinkers (8.7 vs. 5.9 days). However, underage drinkers consumed, on average, more drinks per day on the days they drank in the past month than drinkers aged 21 or older (4.9 vs. 2.8 drinks).
End Notes
1 Office of Applied Studies. (2007). Results from the 2006 National Survey on Drug Use and Health: National findings (DHHS Publication No. SMA 07-4293, NSDUH Series H-32). Rockville, MD: Substance Abuse and Mental Health Services Administration.
2 Office of Applied Studies, Substance Abuse and Mental Health Services Administration. (2006, September 28). Table 7.7B: Alcohol use in the past month and measures of past month alcohol consumption, by detailed age category: 2005. Retrieved March 13, 2008, from http://samhsa.gov/data/NSDUH/2k5NSDUH/tabs/Sect7peTabs1to66.htm#Tab7.7B
3 Institute of Medicine (Bonnie, R. J., & O'Connell, M. E., Eds.). (2004). Reducing underage drinking: A collective responsibility. Washington, DC: The National Academies Press. [Available at http://www.nap.edu/catalog.php?record_id=10729]
4 Hingson, R. W., Heeren, T., Zakocs, R. C., Kopstein, A., & Wechsler, H. (2002). Magnitude of alcohol-related mortality and morbidity among U.S. college students ages 18-24. Journal of Studies on Alcohol 63, (2), 136-144.
5 Grant, B. F., Stinson, F. S, & Harford, T. C. (2001). Age at onset of alcohol use and DSM-IV alcohol abuse and dependence: A 12-year follow-up. Journal of Substance Abuse, 13, 493-504.
6 Office of Applied Studies, Substance Abuse and Mental Health Services Administration. (2007, October 18). Table 7.36B: Alcohol dependence or abuse in the past year among persons aged 21 or older, by age first used alcohol and age group: Percentages, 2005 and 2006. Retrieved March 13, 2008, from http://samhsa.gov/data/NSDUH/2K6NSDUH/tabs/Sect7peTabs1to47.htm#Tab7.36B
7 Swahn, M. H., Bossarte, R. M., & Sullivent, E. E., 3rd (2008). Age of alcohol use initiation, suicidal behavior, and peer and dating violence victimization and perpetration among high-risk, seventh-grade adolescents. Pediatrics, 121, 297-305.
8 Stueve, A., & O'Donnell, L. N. (2005). Early alcohol initiation and subsequent sexual and alcohol risk behaviors among urban youths. American Journal of Public Health, 95, 887-893.
9 Respondents with unknown or missing information regarding the number of alcoholic drinks consumed per day on the days that they drank were excluded from this analysis.
10 Race/ethnicity categories are determined by combining the responses from two separate questions. For this report, respondents identifying themselves as Hispanic were assigned to the Hispanic group regardless of their racial identification. Respondents identifying themselves as non-Hispanic were grouped according to their racial identification. Thus, "white" refers to those identifying themselves as non-Hispanic and white.
Table and Figure Notes
* Standard error (SE) is a measure of the sampling variability or precision of an estimate, where smaller values represent greater precision and larger values represent less precision.
** See End Note 10.
Suggested Citation
Substance Abuse and Mental Health Services Administration, Office of Applied Studies. (March 31, 2008). The NSDUH Report - - Quantity and Frequency of Alcohol Use among Underage Drinkers. Rockville, MD.
The National Survey on Drug Use and Health (NSDUH) is an annual survey sponsored by the Substance Abuse and Mental Health Services Administration (SAMHSA). The 2005 and 2006 data used in this report are based on information obtained from 62,602 persons aged 12 to 20. The survey collects data by administering questionnaires to a representative sample of the population through face-to-face interviews at their place of residence.
The NSDUH Report is prepared by the Office of Applied Studies (OAS), SAMHSA, and by RTI International in Research Triangle Park, North Carolina. (RTI International is a trade name of Research Triangle Institute.)
Information on the most recent NSDUH is available in the following publication:
Office of Applied Studies. (2007). Results from the 2006 National Survey on Drug Use and Health: National findings (DHHS Publication No. SMA 07-4293, NSDUH Series H-32). Rockville, MD: Substance Abuse and Mental Health Services Administration.
Information for the earlier NSDUH is available in the following publication:
2005 NSDUH: (DHHS Publication No. SMA 06-4194, NSDUH Series H-30).
Also available online: http://oas.samhsa.gov.
Because of improvements and modifications to the 2002 NSDUH, estimates from the 2002 through 2006 surveys should not be compared with estimates from the 2001 or earlier versions of the survey to examine changes over time. |
| The NSDUH Report is published periodically by the Office of Applied Studies, Substance Abuse and Mental Health Services Administration (SAMHSA).All material appearing in this report is in the public domain and may be reproduced or copied without permission from SAMHSA. Additional copies of this report or other reports from the Office of Applied Studies are available online: http://oas.samhsa.gov. Citation of the source is appreciated. For questions about this report, please e-mail: shortreports@samhsa.hhs.gov.
NSDUH_109 |
|
This page was last updated on December 30, 2008.
|