
|
| November 20, 2008 |
|
This issue of The NSDUH Report examines how current (i.e., "past month") drinkers aged 12 to 20 obtain alcohol, by age group and gender. The 2006 and 2007 NSDUHs included items that asked past month alcohol users aged 12 to 20 how they obtained the last alcohol they drank. This report also presents data on the prevalence of current underage alcohol use and findings on the average number of drinks that underage drinkers had on their last occasion of alcohol use, depending on where they obtained alcohol. All findings presented are annual averages based on combined 2006 and 2007 NSDUH data.
More than one quarter (28.1 percent) of persons aged 12 to 20 (an estimated 10.8 million persons) used alcohol in the past month. More than half (51.1 percent) of those aged 18 to 20 were current alcohol users compared with 25.9 percent of those aged 15 to 17 and 6.1 percent of those aged 12 to 14. Underage males were more likely than their female counterparts to be current alcohol users (28.8 vs. 27.4 percent).
Nearly one third (30.6 percent) of current alcohol users aged 12 to 20 in 2006 and 2007 (an estimated 3.2 million persons) paid for the last alcohol they used, and 69.4 percent (an estimated 7.3 million persons) got the last alcohol they used for free. More than one in four (26.4 percent) got the last alcohol they used for free from a nonrelative aged 21 or older, 14.6 percent got it for free from another underage person, 5.9 percent got it from a parent or guardian, 8.5 percent got it from another relative aged 21 or older, and 3.9 percent took it from their own home without asking.3
Among underage current alcohol users, over one third (36.5 percent) of persons aged 18 to 20 paid for the last alcohol they drank compared with 23.5 percent of those aged 15 to 17 and 7.5 percent of those aged 12 to 14 (Figure 1).
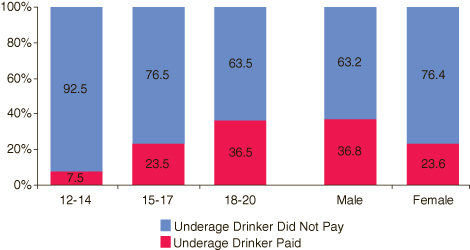 |
| Receipt of Alcohol | Aged 12 to 14 | Aged 15 to 17 | Aged 18 to 20 | Male | Female |
|---|---|---|---|---|---|
| Underage Drinker Paid | 7.5% | 23.5% | 36.5% | 36.8% | 23.6% |
| Underage Drinker Did Not Pay | 92.5% | 76.5% | 63.5% | 63.2% | 76.4% |
| Source: SAMHSA, 2006 and 2007 NSDUHs. |
Current alcohol users aged 18 to 20 also were more likely than their younger counterparts to have gotten alcohol for free from a nonrelative of legal drinking age (30.5 percent compared with 20.3 percent of those aged 15 to 17 and 13.4 percent of those aged 12 to 14) (Figure 2). However, alcohol users aged 18 to 20 were less likely than those aged 12 to 14 to have gotten the last alcohol they used from a parent or guardian (4.2 vs. 16.6 percent), to have taken it from their own home without asking (2.2 vs. 14.0 percent), or to have gotten it from another underage person (11.1 vs. 18.6 percent).
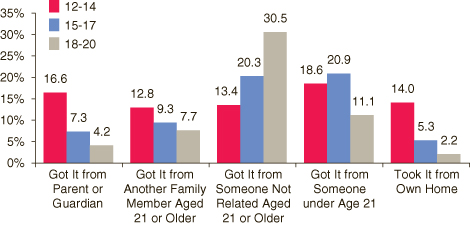 |
| Age Group | Got It from Parent or Guardian | Got It from Another Family Member Aged 21 or Older | Got It from Someone Not Related Aged 21 or Older | Got It from Someone Under Age 21 | Took It from Own Home |
|---|---|---|---|---|---|
| 12 to 14 | 16.6% | 12.8% | 13.4% | 18.6% | 14.0% |
| 15 to 17 | 7.3% | 9.3% | 20.3% | 20.9% | 5.3% |
| 18 to 20 | 4.2% | 7.7% | 30.5% | 11.1% | 2.2% |
| Source: SAMHSA, 2006 and 2007 NSDUHs. |
Underage male alcohol users were more likely than their female counterparts to have paid for the last alcohol they used (36.8 vs. 23.6 percent) (Figure 1). Conversely, more than three fourths of female underage drinkers (76.4 percent) obtained their last alcohol for free compared with 63.2 percent of males. Female underage drinkers were more likely than their male counterparts to have gotten the last alcohol they used for free from a nonrelative of legal drinking age (31.0 vs. 22.1 percent) (Figure 3).
 |
| Gender | Got It from Parent or Guardian | Got It from Another Family Member Aged 21 or Older | Got It from Someone Not Related Aged 21 or Older | Got It from Someone Under Age 21 | Took It from Own Home |
|---|---|---|---|---|---|
| Male | 5.3% | 8.2% | 22.1% | 13.3% | 4.0% |
| Female | 6.7% | 8.9% | 31.0% | 16.0% | 3.8% |
| Source: SAMHSA, 2006 and 2007 NSDUHs. |
Current alcohol users aged 12 to 20 consumed more drinks on average the last time if they paid for the last alcohol they used (6.0 drinks) compared with those who did not pay for their last alcohol (3.9 drinks) (Table 1). Underage current drinkers who got alcohol for free from a nonrelative of legal drinking age consumed more drinks on average (4.3 drinks) than those who got the last alcohol they used from a parent or guardian (2.5 drinks).
| Source of Last Alcohol Used in the Past Month* | Total | Age Group | ||||||
|---|---|---|---|---|---|---|---|---|
| 12 to 14 | 15 to 17 | 18 to 20 | ||||||
| Mean | SE | Mean | SE | Mean | SE | Mean | SE | |
| Total | 4.6 | 0.05 | 2.8 | 0.11 | 4.4 | 0.07 | 4.8 | 0.07 |
| Underage Drinker Paid | 6.0 | 0.11 | 4.8 | 0.50 | 6.3 | 0.18 | 6.0 | 0.13 |
| Underage Drinker Did Not Pay** | 3.9 | 0.04 | 2.7 | 0.10 | 3.8 | 0.07 | 4.2 | 0.06 |
| Got It from Parent or Guardian | 2.5 | 0.10 | 1.7 | 0.11 | 2.1 | 0.11 | 3.1 | 0.19 |
| Got It from Another Family Member Aged 21 or Older | 3.6 | 0.16 | 2.3 | 0.18 | 3.5 | 0.25 | 3.9 | 0.23 |
| Got It from Someone Not Related Aged 21 or Older | 4.3 | 0.07 | 3.4 | 0.38 | 4.3 | 0.14 | 4.3 | 0.09 |
| Got It from Someone under Age 21 | 4.2 | 0.09 | 3.2 | 0.25 | 4.0 | 0.12 | 4.5 | 0.13 |
| Took It from Own Home | 3.0 | 0.18 | 2.3 | 0.25 | 3.6 | 0.32 | 2.9 | 0.28 |
| Source: SAMHSA, 2006 and 2007 NSDUHs. |
These patterns also held within individual age groups of underage alcohol users. For example, current alcohol users aged 12 to 14 who paid for the alcohol themselves consumed an average of 4.8 drinks the last time they drank compared with an average of 2.7 drinks if they did not pay for it. These 12 to 14 year olds consumed an average of 3.4 drinks if they got their alcohol from a nonrelative aged 21 or older and 1.7 drinks if they got it from a parent or guardian. Among current alcohol users aged 18 to 20, those who paid for the last alcohol they used averaged 6.0 drinks compared with 4.2 drinks among those who got it for free.
Even with increased efforts to reduce the availability of alcohol to young people, data from NSDUH indicate that underage drinkers are able to purchase or obtain alcohol from relatives and friends at an unacceptably high rate. This should be of concern to professionals, policymakers, parents, and others who are attempting to reduce the negative consequences of underage alcohol use.
| The National Survey on Drug Use and Health (NSDUH) is an annual survey sponsored by the Substance Abuse and Mental Health Services Administration (SAMHSA). The 2006 and 2007 data used in this report are based on information obtained from 62,495 persons aged 12 to 20. The survey collects data by administering questionnaires to a representative sample of the population through face-to-face interviews at their place of residence. The NSDUH Report is prepared by the Office of Applied Studies (OAS), SAMHSA, and by RTI International in Research Triangle Park, North Carolina. (RTI International is a trade name of Research Triangle Institute.) Information on the most recent NSDUH is available in the following publication: Office of Applied Studies. (2008). Results from the 2007 National Survey on Drug Use and Health: National findings (DHHS Publication No. SMA 08-4343, NSDUH Series H-34). Rockville, MD: Substance Abuse and Mental Health Services Administration. Information for earlier NSDUHs is available in the following publication: 2006 NSDUH (DHHS Publication No. SMA 07-4293, NSDUH Series H-32) Also available online: http://oas.samhsa.gov. Because of improvements and modifications to the 2002 NSDUH, estimates from the 2002 through 2007 surveys should not be compared with estimates from the 2001 or earlier versions of the survey to examine changes over time. |
| The NSDUH Report is published periodically by the Office of Applied Studies, Substance Abuse and Mental Health Services Administration (SAMHSA). All material appearing in this report is in the public domain and may be reproduced or copied without permission from SAMHSA. Additional copies of this report or other reports from the Office of Applied Studies are available online: http://oas.samhsa.gov. Citation of the source is appreciated. For questions about this report, please e-mail: shortreports@samhsa.hhs.gov.
NSDUH_112a |
This page was last updated on December 30, 2008. |