Situation Update: Summary of Weekly FluView
Key Flu Indicators
The first FluView update for the 2012-2013 season reports on influenza activity between September 30 and October 6, 2012. Data for that week across all key indicators shows that influenza activity in the United States is low nationwide. Below is a summary of these key indicators:
- The proportion of visits to doctors for influenza-like illness (ILI) was below the national baseline. All 10 U.S. regions reported ILI activity below region-specific baseline levels. Forty-seven states and New York City experienced minimal ILI activity. The District of Columbia and three states did not report.
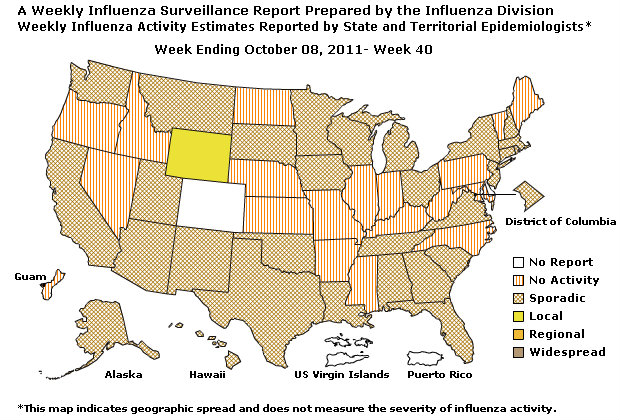
- One state (Wyoming) reported local influenza activity. The District of Columbia and 29 states reported sporadic influenza activity. Guam and 18 states reported no influenza activity. Puerto Rico, the U.S. Virgin Islands, and two states did not report.
- Data regarding influenza-associated hospitalizations for the 2012-2013 influenza season is not yet available, but will be updated weekly starting later this season.
- The proportion of deaths attributed to pneumonia and influenza (P&I) based on the 122 Cities Mortality Reporting System is below the epidemic threshold. During week 40, 5.9% of all deaths reported through the 122 Cities Mortality Reporting System were due to P&I.
- No influenza-related pediatric deaths were reported during that week.
- Nationally, the percentage of respiratory specimens testing positive for influenza viruses in the United States during that week was 2.6%. The regional percentage of respiratory specimens testing positive for influenza viruses ranged from 0.4% to 6.3%.
- Both influenza A and influenza B viruses have already been identified this season. This includes both of the currently circulating subtypes of influenza A viruses, H3N2 and 2009 H1N1. During the week of September 30 through October 6, 2012, 39 of the 75 influenza positive tests reported to CDC were influenza A and 36 were influenza B viruses. Among the 39 influenza A viruses identified that week, approximately 69% were H3N2 viruses and 8% were 2009 H1N1 viruses; 23% were not subtyped.
- There is no antiviral resistance data available for specimens collected during the week of September 30 through October 6, 2012. Antiviral resistance data will be updated weekly starting later in the season.
FluView is available – and past issues are archived – on the CDC website.

Contact Us:
- Centers for Disease Control and Prevention
1600 Clifton Rd
Atlanta, GA 30333 - 800-CDC-INFO
(800-232-4636)
TTY: (888) 232-6348 - Contact CDC-INFO
