|
|
Printer-friendly version
Workplace Safety and Health in the Health Care and Social Assistance Industry, 2003-07
by Jill A. Janocha and Ryan T. Smith
Bureau of Labor Statistics
Originally Posted: August 30, 2010
The health care and social assistance industry is characterized by large employment, diverse demographics, and unique occupational safety issues. Over the 5-year period from 2003 to 2007, the number of nonfatal injuries and illnesses in private industry declined; over the same period, the number of fatal occupational injuries in all industries increased somewhat, averaging 129 per year.
The health care and social assistance sector employed an estimated 15.1 million people in 2007; it is the second largest industry sector in the Nation, with more persons employed than any other industry sector except retail trade.1 Of the workers in the health care and social assistance sector, 9.8 percent are government workers and another 5.2 percent are self-employed.2 Workplace safety and health information for both of these groups is captured in the Bureau of Labor Statistics (BLS) Census of Fatal Occupational Injuries (CFOI) program, but not in the Survey of Occupational Injuries and Illnesses (SOII).3 Workers in this sector are at risk for illnesses, injuries, and fatalities because of long hours, changing shifts, physically demanding tasks, violence, and exposure to infectious diseases and hazardous chemicals.4 This study covers the 5-year period from 2003 to 2007 and includes private industry workers for nonfatal injuries and all workers for fatal injuries in the health care and social assistance industry as defined in the North American Industry Classification System (NAICS).5
The health care and social assistance sector is comprised of four subsectors: ambulatory health care services, hospitals, nursing and residential care facilities, and social assistance. The sector is made up of establishments providing both health care and social assistance because it is often difficult to distinguish between these activities. “The industries in the sector are arranged on a continuum starting with those establishments providing medical care exclusively, continuing with those providing health care and social assistance, and finally finishing with those providing only social assistance.”6
One major difference between the health care and social assistance industry and all other industries is that women make up nearly 80 percent of all private wage and salaried workers in health care and social assistance, whereas they make up only 45.3 percent of all other industries combined. As can be seen in table 1, the percentage of women workers in health care and social assistance is 14 percentage points above the industry with the second highest percentage of women employed (educational services), and nearly 20 percentage points above the industry with the third highest percentage of women employed (finance and insurance).
Table 1. Employment by industry sector, 2007
| Industry sector |
Total employment
(in thousands) |
Percent women |
Percent black |
Total employment |
114,833.4 |
45.3 |
10.4 |
Agriculture, forestry, fishing, and hunting |
997.6 |
20.0 |
3.3 |
Mining |
640.8 |
13.5 |
4.1 |
Construction |
7,790.6 |
10.1 |
5.0 |
Manufacturing |
14,071.4 |
29.8 |
9.5 |
Wholesale trade |
6,031.9 |
29.4 |
8.0 |
Retail trade |
15,675.9 |
49.0 |
10.3 |
Transportation and warehousing |
4,309.2 |
23.0 |
17.0 |
Utilities |
548.9 |
22.0 |
10.5 |
Information |
3,001.3 |
40.2 |
11.6 |
Finance and insurance |
6,092.5 |
59.9 |
10.1 |
Real estate and rental and leasing |
2,168.4 |
47.4 |
8.5 |
Professional and technical services |
7,670.7 |
44.6 |
6.0 |
Management of companies and enterprises |
1,853.2 |
51.6 |
7.6 |
Administrative and support and waste management and remediation services |
8,453.9 |
40.9 |
14.5 |
Educational services |
2,291.8 |
65.3 |
10.1 |
Health care and social assistance |
15,076.9 |
79.4 |
15.4 |
Arts, entertainment, and recreation |
2,076.0 |
48.1 |
8.3 |
Accommodation and food services |
11,510.8 |
53.0 |
10.8 |
Other services |
4,571.7 |
52.2 |
9.8 |
Nonfatal injuries and illnesses
In 2007 there were 670,600 injuries and illnesses in the health care and social assistance industry, with an injury and illness rate of 5.6 per 100 full-time workers compared with 4.2 for all of private industry. (See chart 1 below.) Nearly half (45.3 percent) of these injuries and illnesses required days away from work, job transfer, or restriction. Cases with at least 1 day away from work numbered 171,020 injuries and illnesses, or a rate of 1.4 per 100 full-time workers.
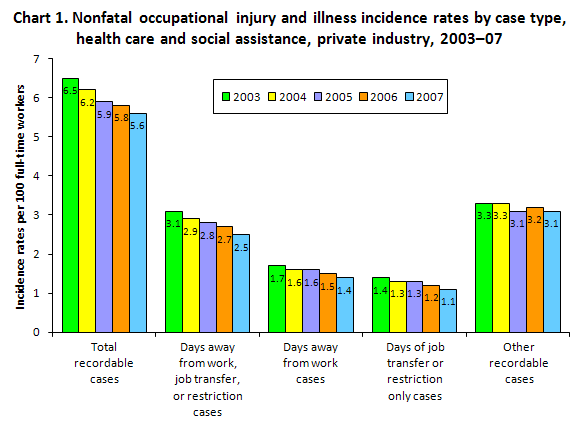
As can be seen in table 2 below, the total number of injuries and illnesses in health care and social assistance had a 3.9-percent decrease in the number of injuries and illnesses from 2003 to 2007 while employment increased by nearly 10 percent. This resulted in a 13.8-percent reduction in the incidence rate over the 5-year timeframe. Injuries and illnesses in health care and social assistance accounted for 16.8 percent of the 4 million occupational injuries and illnesses in 2007.
Table 2. Number of nonfatal occupational injuries and illnesses by selected industry, total private industry, 2003-07
(Numbers in thousands)
| Characteristic |
Private industry |
Health care and social assistance |
| 2003 |
2004 |
2005 |
2006 |
2007 |
2003 |
2004 |
2005 |
2006 |
2007 |
| Injuries and illnesses |
|
|
|
|
|
|
|
|
|
|
Total cases |
4,365.2 |
4,257.3 |
4,214.2 |
4,085.4 |
4,002.7 |
698.1 |
684.0 |
668.9 |
675.2 |
670.6 |
Cases with days away from work, job transfer, or restriction |
2,301.9 |
2,225.0 |
2,184.8 |
2,114.6 |
2,036.0 |
337.9 |
322.8 |
318.4 |
310.0 |
303.7 |
Cases with days away from work |
1,315.9 |
1,259.3 |
1,234.7 |
1,183.5 |
1,158.9 |
188.4 |
179.9 |
175.9 |
171.8 |
171.0 |
Cases with job transfer or restriction |
986.0 |
965.7 |
950.1 |
931.1 |
877.2 |
149.5 |
142.9 |
142.5 |
138.2 |
132.7 |
Other recordable cases |
2,063.3 |
2,032.3 |
2,029.4 |
1,970.8 |
1,966.7 |
360.2 |
361.2 |
350.6 |
365.2 |
366.9 |
| Injuries |
|
|
|
|
|
|
|
|
|
|
Total cases |
4,095.7 |
4,008.3 |
3,971.7 |
3,857.4 |
3,796.4 |
649.8 |
638.0 |
623.9 |
628.1 |
630.1 |
| Illnesses |
|
|
|
|
|
|
|
|
|
|
Total cases |
269.5 |
249.0 |
242.5 |
228.0 |
206.3 |
48.3 |
45.9 |
45.0 |
47.1 |
40.5 |
| Illness categories |
|
|
|
|
|
|
|
|
|
|
Skin disorders |
43.4 |
38.9 |
40.1 |
41.4 |
35.3 |
10.1 |
7.1 |
7.9 |
9.2 |
7.3 |
Respiratory conditions |
19.0 |
17.6 |
20.2 |
17.7 |
16.7 |
6.4 |
5.7 |
5.8 |
6.4 |
5.3 |
Poisoning |
3.9 |
3.3 |
2.8 |
3.4 |
3.4 |
0.6 |
0.4 |
0.3 |
0.2 |
0.4 |
Hearing loss |
-- |
28.4 |
26.9 |
24.4 |
23.0 |
-- |
0.1 |
0.1 |
0.1 |
0.1 |
All other illness cases |
203.2 |
160.9 |
152.4 |
141.1 |
127.9 |
31.3 |
32.6 |
30.9 |
31.1 |
27.4 |
|
Note: Dashes indicate data do not meet publication standards. As a result of rounding, some numbers may not sum to totals.
|
Hospitals, a major component industry within health care and social assistance, reported nearly 270,000 nonfatal injuries and illnesses in 2007 (as shown in table 3 below). According to the National Institute for Occupational Safety and Health (NIOSH), hospitals led the list of industries that reported 100,000 or more occupational injury and illness cases over the 4-year period from 2003 to 2006.7 The hospital industry constitutes 29.5 percent of health care and social assistance employment, but accounts for 40.1 percent of all of the injuries and illnesses within the sector. The same NIOSH report states that two other health care and social assistance component industries shown in table 3—ambulatory health care services and nursing and residential care facilities—were also on the list of industries with 100,000 or more occupational injury and illness cases during the 2003-06 period.
Table 3. Number and incidence rate of total recordable injuries and illnesses in Health Care and Social Assistance, all United States, private industry, 2007
| Industry |
Employment
(in thousands) |
Total recordable injuries and illnesses
(in thousands) |
Rate |
Total private industry |
114,833.4 |
4,002.7 |
4.2 |
Health care and social assistance |
15,076.9 |
670.6 |
5.6 |
Ambulatory health care services |
5,454.7 |
130.2 |
3.0 |
Hospitals |
4,442.1 |
268.8 |
7.7 |
Nursing and residential care facilities |
2,920.2 |
204.3 |
8.8 |
Social assistance |
2,259.9 |
67.3 |
3.9 |
|
Note: Numbers represent private industry wage and salary workers. Self-employed and government workers are not included in this table. The total employment numbers may be found online at: www.bls.gov/iif/oshsum.htm.
|
Table 4 shows that the health care and social assistance industry had an incidence rate of skin disorders and respiratory conditions that was higher than the national average for 2007, but that the rate of poisonings and hearing loss was lower.
Table 4. Number and rate of nonfatal occupational injuries and illnesses in health care and social assistance, total private industry, 2007
| Characteristic |
Private industry |
Health care and social assistance |
| Number
(in thousands) |
Rate |
Number
(in thousands) |
Rate |
| Injuries and Illnesses |
|
|
|
|
Total cases |
4,002.7 |
4.2 |
670.6 |
5.6 |
Cases with days away from work, job transfer, or restriction |
2,036.0 |
2.1 |
303.7 |
2.5 |
Cases with days away from work |
1,158.9 |
1.2 |
171.0 |
1.4 |
Cases with job transfer or restriction |
877.2 |
0.9 |
132.7 |
1.1 |
Other recordable cases |
1,966.7 |
2.1 |
366.9 |
3.1 |
| Injuries |
|
|
|
|
Total cases |
3,796.4 |
4.0 |
630.1 |
5.3 |
| Illnesses |
|
|
|
|
Total cases |
206.3 |
21.8 |
40.5 |
34.0 |
| Illness categories |
|
|
|
|
Skin disorders |
35.3 |
3.7 |
7.3 |
6.1 |
Respiratory conditions |
16.7 |
1.8 |
5.3 |
4.4 |
Poisoning |
3.4 |
0.4 |
0.4 |
0.3 |
Hearing loss |
23.0 |
2.4 |
0.1 |
0.1 |
All other illness cases |
127.9 |
13.5 |
27.4 |
23.0 |
Nonfatal injuries and illnesses that resulted in days away from work
Occupation.8 Table 5 shows data for the five occupations in health care and social assistance that had the largest number of injuries and illnesses with days away from work in 2007: nursing aides, orderlies and attendants; registered nurses; home health aides; licensed practical and licensed vocational nurses; and maids and housekeeping cleaners. These occupations accounted for half of the injuries and illnesses in health care and social assistance. The group nursing aides, orderlies, and attendants was by far the largest contributor, accounting for 26 percent of the injuries and illnesses in health care and social assistance. Registered nurses were second with 11.4 percent. Across all industries, nursing aides, orderlies, and attendants and registered nurses were among the occupations that had the highest number of injuries or illnesses in 2007.
Table 5. Number of occupational injury and illness cases involving days away from work by selected occupations in health care and social assistance, total private industry, 2007
| Occupation |
Total Cases |
Median Days away from work |
All Occupations in Health care and social assistance |
171,020 |
6 |
Nursing Aides, Orderlies, and Attendants |
44,440 |
5 |
Registered Nurses |
19,500 |
7 |
Home Health Aides |
8,220 |
8 |
Licensed Practical and Licensed Vocational Nurses |
6,580 |
6 |
Maids and Housekeeping Cleaners |
6,380 |
5 |
|
Note: Median days away from work is the measure used to summarize the varying lengths of absences from work among the cases with days away from work. Half the cases involved more days and half involved less days than a specified median. Median days away from work are represented in actual values. Days away from work cases include those which result in days away from work with or without restricted work activity.
|
Nature of injury.9 Table 6 shows data for the most common nature of injury suffered in the health care and social assistance industry in each year during the 2003-07 period—sprains, strains, and tears—which accounted for 86,060 injuries in 2007. This represents a decline of 16.3 percent from the 2003 figure of 102,770. This type of injury also represents 50.3 percent of the total number of lost work-time injury and illness cases in health care and social assistance (the average for all industries is only 38.7 percent).
Table 6. Sprains, strains, and tears involving days away from work in the health care and social assistance industry, total private industry, 2003-07
| Year |
Sprains, strains, and tears involving days away from work |
2003 |
102,770 |
2004 |
95,500 |
2005 |
92,910 |
2006 |
86,130 |
2007 |
86,060 |
|
Note: Days away from work cases include those resulting in days away from work with or without restricted work activity.
|
A common cause of these injuries in health care and social assistance for both men and women was overexertion in lifting. As shown in table 7, there were a total of 29,840 sprains, strains, and tears on the job that resulted from overexertion in lifting in 2003, with 82.5 percent occurring to women. By 2007, the total number had dropped to 21,490 (a 28.0-percent decline) and the percentage among women had dropped to 80.9 percent. Although women had more than 4 times the number of sprain, strain, and tear injuries, both men and women had roughly the same percentage of these injuries as a proportion of their overall injuries and illnesses.
Table 7. Sprains, strains, or tears due to overexertion in lifting requiring days away from work in the health care and social assistance industry, by gender, total private industry, 2003-07
| Gender |
2003 |
2004 |
2005 |
2006 |
2007 |
Men |
5,220 |
5,070 |
5,200 |
4,770 |
4,100 |
Women |
24,620 |
20,600 |
19,880 |
18,020 |
17,380 |
Total |
29,840 |
25,680 |
25,080 |
22,800 |
21,490 |
|
Note: As a result of rounding, numbers may not sum to totals.
|
Source.10 Table 8 shows the sources of injuries and illnesses in the health care and social assistance industry. As can be seen in the table, the most common source was a health care patient, from which a total of 49,370 injuries or illnesses occurred in 2007. Of these, 16,520 were due to overexertion in lifting the patient. In 2003, about a third of the injuries or illnesses that required days away from work were attributable to a health care patient as the source. These injuries have steadily declined each year since 2003 for a total decline of 19.5 percent, or an estimated 11,940 fewer injuries and illnesses over the 5-year period. The next most common source in 2007 was floors or ground surfaces, with 39,590 injuries and illnesses. This represents an 8.2-percent increase over 2003, when the figure was 36,590.
Table 8. Number of nonfatal injuries and illnesses requiring days away from work in the health care and social assistance industry, by source, total private industry, 2003-07
| Source of injury, illness: |
2003 |
2004 |
2005 |
2006 |
2007 |
Chemicals chemical products |
2,490 |
3,130 |
2,370 |
3,110 |
2,370 |
Containers |
9,610 |
9,660 |
10,030 |
9,630 |
8,730 |
Furniture, fixtures |
8,760 |
8,710 |
8,540 |
8,190 |
8,410 |
Machinery |
4,130 |
3,870 |
4,030 |
3,660 |
3,390 |
Parts and materials |
1,560 |
2,040 |
1,870 |
1,650 |
1,930 |
Worker motion or position |
24,940 |
23,770 |
21,040 |
20,610 |
21,080 |
Floor, ground surfaces |
36,590 |
35,720 |
38,820 |
36,430 |
39,590 |
Handtools |
2,250 |
1,920 |
2,070 |
2,050 |
2,210 |
Vehicles |
9,840 |
8,810 |
9,960 |
9,230 |
9,060 |
Health care patient |
61,310 |
55,710 |
53,580 |
51,230 |
49,370 |
All other |
26,930 |
26,560 |
23,590 |
26,050 |
19,410 |
Event.11 Table 9 shows the number of nonfatal injuries and illnesses in health care and social assistance that required days away from work by event or exposure for the 2003-07 period. The most common event that led to an injury during any of the 5 years was overexertion, which accounted for 38.6 percent of all injuries and illnesses in the industry in 2003, but dropped to 34.5 percent in 2007. Over the 5-year span, there were only two categories of events that had an increase in the number of injuries every year except one: falls, and assaults and violent acts. Although health care and social assistance accounted for only 13.1 percent of the overall workforce in 2007, it accounted for 16.2 percent of the total number of falls that year. In addition, a worker in health care and social assistance is nearly 5 times more likely to be the victim of a nonfatal assault or violent act by person than the average worker in all industries combined.
Table 9. Number of nonfatal injuries and illnesses requiring days away from work in the health care and social assistance industry, by event or exposure, total private industry, 2003-07
| Event or exposure: |
2003 |
2004 |
2005 |
2006 |
2007 |
Total |
188,410 |
179,910 |
175,900 |
171,820 |
171,020 |
Contact with object or equipment |
24,480 |
23,220 |
22,630 |
22,310 |
22,890 |
Struck by object |
11,900 |
11,330 |
11,450 |
11,550 |
11,900 |
Struck against object |
8,250 |
7,980 |
6,500 |
7,050 |
7,160 |
Caught in object, equipment, material |
3,030 |
2,730 |
3,000 |
2,400 |
2,390 |
Fall to lower level |
5,900 |
5,000 |
5,730 |
5,590 |
5,350 |
Fall on same level |
31,530 |
31,700 |
34,330 |
31,210 |
34,570 |
Slips, trips |
6,290 |
5,640 |
5,120 |
5,040 |
6,290 |
Overexertion |
72,820 |
65,500 |
64,530 |
61,760 |
59,050 |
Overexertion in lifting |
35,240 |
30,890 |
30,460 |
27,870 |
26,270 |
Repetitive motion |
4,870 |
5,160 |
3,500 |
3,650 |
3,150 |
Exposed to harmful substance |
8,100 |
8,400 |
7,270 |
9,540 |
7,230 |
Transportation accidents |
6,230 |
5,380 |
6,980 |
6,020 |
5,950 |
Fires, explosions |
- |
50 |
120 |
100 |
90 |
Assault violent act |
10,340 |
12,320 |
9,960 |
10,130 |
10,490 |
by person |
9,710 |
11,790 |
9,510 |
9,640 |
9,950 |
by other |
630 |
530 |
450 |
490 |
540 |
All other |
17,820 |
17,550 |
15,740 |
16,470 |
15,970 |
|
NOTE: Dashes indicate data that do not meet publication standards. As a result of rounding, numbers may not sum to totals.
|
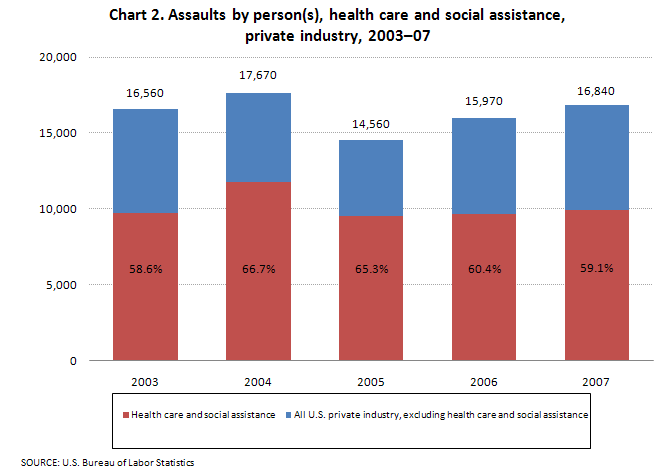
As shown in chart 2, nearly 60 percent of all nonfatal assaults and violent acts by persons occurred in the health care and social assistance industry, but nearly three-quarters of these were assaults by health care patients or residents of a health care facility. The most common victims of assaults in 2007 were nursing aides, orderlies, and attendants, with 15.7 percent of all assaults by persons in any industry occurring to workers in this occupational group.
As can be seen in table 10, of the cases of assaults and violent acts by persons for which the time of the incident was reported, 68.2 percent occurred during the 12-hour period from 8:01 a.m. to 8:00 p.m. Assaults by persons suffered during the late evening hours of 8:01 p.m. to 12:00 a.m. resulted in a median of 7 days away from work, more than at any other time during the day. Median days away from work is a key measure of the severity of an injury or illness.
Table 10. Assaults and violent acts by a person or persons that required days away from work in the health care and social assistance industry, total private industry, 2007
| Time of Day Group |
Number |
Percent of total cases |
Median Days |
Total |
9,950 |
100.0 |
4 |
12:01 AM to 4:00 AM |
520 |
5.2 |
5 |
4:01 AM to 8:00 AM |
1,130 |
11.4 |
2 |
8:01 AM to 12 Noon |
1,940 |
19.5 |
4 |
12:01 PM to 4:00 PM |
2,130 |
21.4 |
4 |
4:01 PM to 8:00 PM |
2,140 |
21.5 |
5 |
8:01 PM to 12 Midnight |
1,260 |
12.7 |
7 |
Time not reported |
840 |
8.4 |
4 |
|
Note: As a result of rounding, numbers may not sum to totals.
|
Race and ethnicity.12 As shown in table 11, below, African Americans represented 15.4 percent of employment in the health care and social assistance industry in 2007, for a total of about 2.3 million employed—more than in any other industry.
Table 11. Number of persons employed in heath care and social assistance, by gender and ethnicity, total private industry, 2003-07
| Year |
Health Care and Social Assistance |
| Total employed
(in thousands) |
Women |
White |
Black or African American |
Asian |
Hispanic or Latino |
2003 |
13,721.9 |
80.3 |
69.2 |
15.1 |
4.9 |
9.1 |
2004 |
14,005.7 |
79.9 |
68.8 |
15.0 |
4.9 |
9.5 |
2005 |
14,256.4 |
80.1 |
68.4 |
15.1 |
5.2 |
9.5 |
2006 |
14,605.8 |
79.7 |
67.7 |
15.8 |
5.3 |
9.4 |
2007 |
15,076.9 |
79.4 |
67.5 |
15.4 |
5.4 |
9.9 |
|
Note: Employment is expressed as an annual average and is derived primarily from the BLS Quarterly Census of Employment and Wages. The percentages stated are from the BLS Current Population Survey (CPS) and include employees aged 16 years old and older. Private industry employment and percentages includes only wage and salary workers. Percentages of women workers are from the CPS. Percentages of workers by race or ethnicity are from the CPS; racial categories exclude those that are of Hispanic or Latino ethnicity. Persons whose ethnicity is identified as Hispanic or Latino may be of any race.
|
One factor that makes comparative analysis difficult for race or ethnicity is that more than 30 percent of cases that involved lost work time reported to the Survey of Occupational Injuries and Illnesses in 2007 did not include the race or ethnicity of the injured worker.13 Still, as shown in table 12, of those cases that did report race or ethnicity, the number of lost work-time cases for African Americans in the health care and social assistance industry declined by 1.4 percent from 2003 to 2007, whereas the number for Whites declined by nearly 15 percent over the same period. In addition, the number of injuries and illnesses to Hispanic or Latino workers in this industry rose by 1.6 percent during the 5-year period, but the number employed from this ethnic group rose by 19.5 percent.14
Table 12. Number of nonfatal injuries and illnesses that involved days away from work in heath care and social assistance, by race or ethnic origin, total private industry, 2003-07
| Race or ethnic origin: |
Health Care and Social Assistance |
| 2003 |
2004 |
2005 |
2006 |
2007 |
White |
87,720 |
80,980 |
79,320 |
75,450 |
74,620 |
Black or African American |
27,400 |
30,250 |
28,680 |
25,290 |
27,030 |
Hispanic or Latino |
13,520 |
14,710 |
11,930 |
13,580 |
13,730 |
Asian |
2,910 |
2,950 |
2,930 |
2,600 |
2,880 |
Native Hawaiian or other Pacific Islander |
960 |
740 |
530 |
660 |
590 |
American Indian or Alaska Native |
810 |
630 |
740 |
670 |
1060 |
Hispanic and other |
150 |
40 |
230 |
40 |
290 |
Multi-race |
190 |
200 |
220 |
120 |
130 |
Not reported |
54,740 |
49,410 |
51,320 |
53,410 |
50,690 |
|
Note: Persons whose ethnicity is identified as Hispanic or Latino may be of any race.
|
Gender. As shown in table 11, above, women made up approximately 80 percent of the workforce in health care and social assistance throughout the 2003-07 period. Women also generally account for about 80 percent of the reported injuries and illnesses involving lost work-time in this industry. This stands in contrast to the comparable figures for total private industry, where women made up 45.3 percent of employment and 35.3 percent of the total number of injuries and illnesses. The 140,140 injuries and illnesses to women in the health care and social assistance industry in 2007 represents more than one-third of the total in private industry (409,040).
Fatal Occupational Injuries
Data for fatal injuries, unlike those for nonfatal injuries and illnesses, include all ownership types, meaning private industry, Federal, State, and local government, as well as resident military personnel. BLS reported an average of 129 fatal injuries in health care and social assistance each year from 2003 to 2007.15 The fatal injury rate for all ownerships in health care and social assistance over the 5-year period averaged 0.8 per 100,000 workers, compared with an average rate of 4.0 for workers in all industries.16
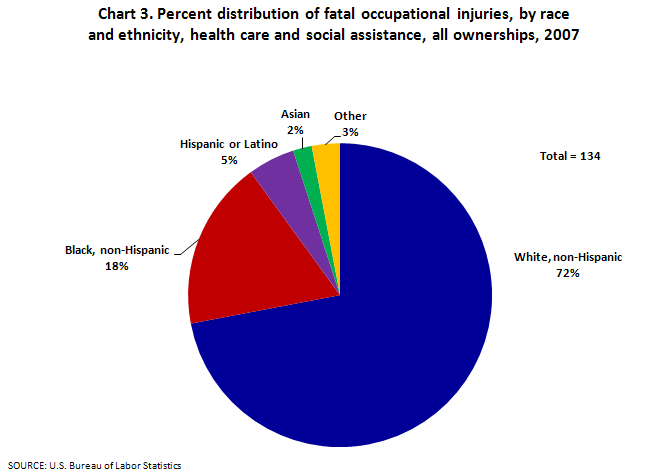
Race and ethnicity.17 White workers (non-Hispanic) represented 67 percent of employment in the health care and social assistance industry in 2007, and 72 percent of the fatal injuries. (See chart 3 below.) These percentages are similar to those for all industries, where Whites (non-Hispanic) account for 69 percent of employment and almost 70 percent of the fatal injuries.
Age. Employees between the ages of 45 and 54 suffer the most fatal occupational injuries in the health care and social assistance industry. The distribution of fatal injuries across age groups in health care and social assistance is similar to that of all workplace fatalities.
Gender. Although the majority of the workers in this industry are women (almost 80 percent), throughout the 5-year period covered in this study, women accounted for less than half of the fatal occupational injuries in the industry, which indicates a disparity between the fatality rates for women and those for men. The fatal injury rate for women in health care and social assistance was 0.5 per 100,000 workers in 2007, compared with a rate of 1.7 per 100,000 workers for men.18 For all industries (in 2007), men have a fatal injury rate of 6.6 per 100,000 workers, and women have a rate of 0.6 per 100,000 workers. Note that the rate for women in health care and social assistance industry is similar to the all-industry rate for women, but the rate for men in health care and social assistance is much lower than the all-industry rate for men.
Event.19 As shown in chart 4, when fatal injury rates are broken down by event or exposure and by gender, men have higher rates in every category--in some cases, as much as 5 times the rate for women.
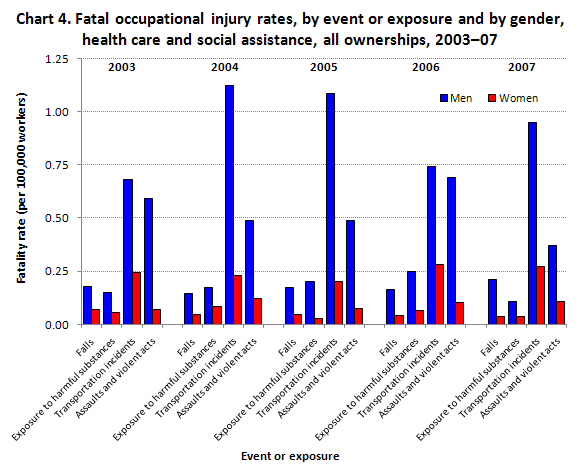
Chart 5 shows that transportation accidents were the most frequent event leading to a fatal injury in the health care and social assistance industry, accounting for 55.2 percent in 2007. This is not surprising considering that transportation incidents account for the highest percentage of events leading to fatalities for all industries (41.6 in 2007).
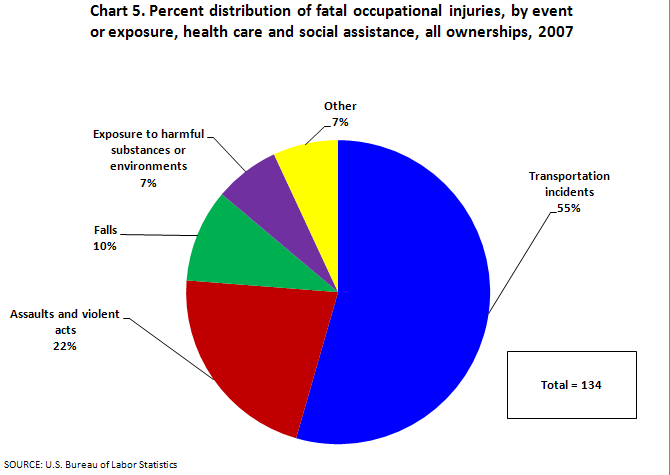
Aircraft accidents, a subcategory of transportation accidents, increased sharply from 2003 to 2007 in health care and social assistance. In 2003 there were 8 fatalities that resulted from aircraft accidents and in 2007 there were 18, more than twice as many as in 2003. Of the 78 fatal injuries over the 5-year period, the vast majority (about 90 percent) were associated with some type of emergency service or medical transport activity.
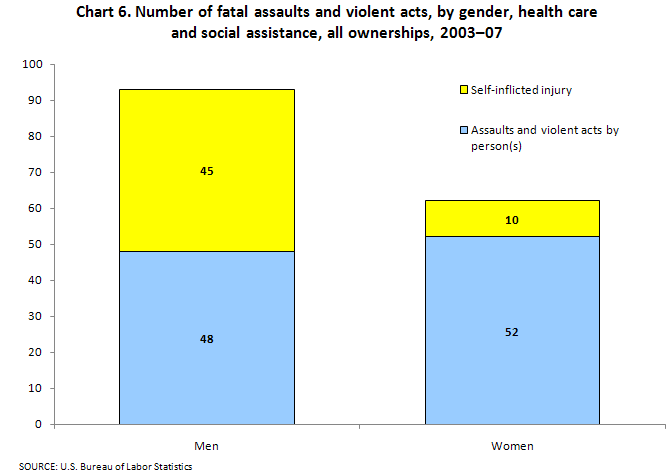
The annual number of fatal assaults and violent acts changed little over the period, averaging 31 per year from 2003 to 2007. It is interesting to note that fatal assaults and violent acts are more likely to happen to men, whereas the opposite is the case with nonfatal incidents. Of the total of 155 fatal assaults and violent acts, 93 of the victims were men (60 percent) and 62 were women. As shown in chart 6, there is also a distinct difference in the type of assaults and violent acts that occur among men and among women. Among men, suicides accounted for almost half of assaults and violent acts during the period, whereas they accounted for only about a sixth of the assaults and violent acts against women. In addition, of the nonfatal assaults and violent acts, there were very few self-inflicted injuries during the 5-year period, but 55 of the 155 fatal incidents were self-inflicted (35.5 percent).
Occupation.20 Health care practitioners and technical occupations had the highest percentage of fatal occupational injuries within the health care and social assistance industry, with 239 fatal injuries (37.1 percent) during the 5-year period. Fatalities increased 45.9 percent, from 37 fatalities in 2003 to 54 fatalities in 2007. Registered nurses, a subset of health care practitioners and technical occupations, had a large increase, from 7 fatal workplace injuries in 2003 to 24 in 2007. Physicians and surgeons experienced a 30.8-percent decrease, with 9 fatal injuries in 2007 and 13 in 2003.
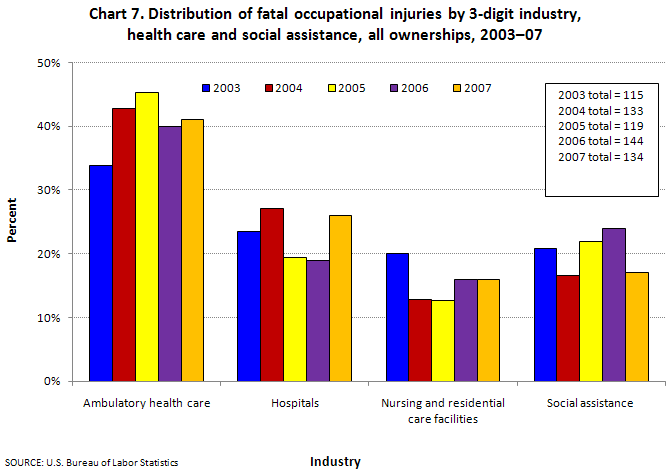
Subindustries within health care and social assistance. The health care and social assistance industry includes four subcategories. Chart 7 shows the percentage each subcategory contributed to total fatal occupational injuries in the industry, which includes ambulatory health care services, hospitals, nursing and residential care facilities, and social assistance. A larger proportion of the fatal injuries occurred in the ambulatory health care services industry in 2007 (41 percent) than in 2003 (34 percent). Hospitals, which account for about a third of the employment for the industry, accounted for 23 percent of fatal injuries in 2003 and 26 percent in 2007. Nursing and residential care facilities experienced an 8.7-percent decrease overall, while the social assistance category remained about the same, averaging 26 fatalities annually over the 5-year period.
Conclusion
Health care and social assistance is an industry with large employment, diverse demographics, and unique occupational safety issues. This industry accounted for the majority of all nonfatal assaults by persons and more than a third of all nonfatal workplace injuries or illnesses to women in 2007. The fatal injury rate over the 2003-07 period averaged 0.8 per 100,000 workers in health care and social assistance, compared with an average rate of 4.0 per 100,000 workers in all industries. The occupational safety and health statistics described in this article can be used to develop means to reduce future injuries, illnesses, and fatal occupational injuries to workers in this important industry.
Jill A. Janocha
Economist, Office of Safety, Health, and Working Conditions, Bureau of Labor Statistics.
Telephone: (202) 691-6217; E-mail: Janocha.Jill@bls.gov.
Ryan T. Smith
Economist, Office of Safety, Health, and Working Conditions, Bureau of Labor Statistics.
Telephone: (202) 691-6167; E-mail: Smith.Ryan@bls.gov.
Notes
1 The health care and social assistance sector is code 62 in the North American Industry Classification System (NAICS). In this article, the terms “sector” and “industry” are used interchangeably when referring to health care and social assistance. For more information, see the NAICS page on the BLS Web site at http://www.bls.gov/bls/naics.htm.The employment figure of 15.1 million is an annual average for 2007 and is derived primarily from the BLS Quarterly Census of Employment and Wages; the figure is for private industry only and can be found in the BLS news release Workplace Injuries and Illnesses in 2007, USDL-08-1498 (U.S. Department of Labor), October 23, 2008, table 1, on the Internet at http://www.bls.gov/iif/oshwc/osh/os/osnr0030.pdf.
2 These percentages are from the BLS Current Population Survey (CPS). The CPS is a national monthly survey of about 60,000 households conducted by the U.S. Census Bureau for the Bureau of Labor Statistics. The CPS uses a sample of households that is designed to represent the civilian noninstitutional population of the United States. For more information, see the CPS page of the BLS Web site at http://www.bls.gov/cps/.
3 The data in the nonfatal injuries and illnesses section of this article are for private industry wage and salary workers only, while the fatalities section includes data for all ownerships and the self-employed. For more information on the Occupational Safety and Health Statistics program, see http://www.bls.gov/iif/.
4 See “Health Care and Social Assistance” on the National Institute for Occupational Safety and Health (NIOSH) Web site at http://www.cdc.gov/niosh/programs/hcsa/ (accessed July 6, 2010).
5 This article includes only private industry data because data for nonfatal injuries and illnesses for State and local government workers were not available until the 2008 survey year. For more information on the North American Industry Classification System (NAICS), see the NAICS page on the BLS Web site at http://www.bls.gov/bls/naics.htm.
6 In the nonfatal injuries and illness section of this article, rates are calculated using a combination of employment data from the Current Employment Statistics (CES) survey and the Current Population Survey (CPS).
7 See “Health Care and Social Assistance” on the National Institute for Occupational Safety and Health (NIOSH) Web site at http://www.cdc.gov/niosh/programs/hcsa/ (accessed July 6, 2010).
8 Occupations are based on the Standard Occupational Classification Manual, 2000 (Washington, D.C., Office of Management and Budget, October 2000).
9 The Office of Safety, Health and Working Conditions uses the Occupational Injury and Illness Classification System (OIICS) to define the event that precipitated the fatal injury as well as the source of the fatal injury and nature of the fatal injury. For more information, see the OIICS page on the BLS Web site at http://www.bls.gov/iif/oshoiics.htm.
10 See note 9.
11 See note 9.
12 The percentages of employment based on demographic characteristics such as race and sex are calculated from the Current Population Survey (CPS) and include only private wage and salary workers. The figures on total employment are from the Current Employment Statistics (CES) survey and are published in the Survey of Occupational Injuries and Illnesses (SOII) annual summary tables for 2007 at http://www.bls.gov/iif/oshsum.htm.
13 Roughly 30 percent of the occupational injury or illness cases collected by the BLS Survey of Occupational Injuries and Illnesses (SOII) each year do not have information for race or ethnicity. The SOII includes a separate race or ethnicity category for “Hispanic and other.” Note that persons whose ethnicity is identified as Hispanic or Latino may be of any race.
14 Employment figures for race or ethnicity use a combination of data from the Current Population Survey (CPS) and the Quarterly Census of Employment and Wages (QCEW).
15 All fatalities data in this article are final.
16 The data in this article for employment and for fatalities are for all ownership types. The employment data in the fatalities section are from the Current Population Survey.
17 Persons whose ethnicity is identified as Hispanic or Latino may be of any race.
18 The BLS published fatality rates for the health care and social assistance sector are for private industry only. This is to ensure that the numerator and denominator are comparing the same worker group due to CPS data limitations.
19 See note 9.
20 Occupations are based on the Standard Occupational Classification Manual, 2000 (Washington, D.C., Office of Management and Budget, October 2000).
|