Evaluation Manual: Step 2 - Describe the Program
Pages in this Manual
Introduction to Program Evaluation for Public Health Program
Evaluating Appropriate Antibiotic Use Programs
Released April 2006
![]() Print-friendly version of Section 2 (254 KB, 27 pages)
Print-friendly version of Section 2 (254 KB, 27 pages)
Developing a comprehensive program description is the next step in the CDC Framework. A comprehensive program description clarifies all the components and intended outcomes of the program, thus helping you focus your evaluation on the most central and important questions. Note that in this step you are describing the program and not the evaluation. In this chapter, you will use a tool called “logic modeling” to depict these program components, but a program description can be developed without using this or any tool.
This step can either follow the stakeholder step or precede it. In either case, the combination of stakeholder engagement and program description produces clarity and consensus long before data are available to measure program effectiveness. This clarity on activities, outcomes, and their inter-relationships sets the stage for good program evaluation; in addition, they can be helpful in strategic planning and performance measurement, ensuring that insights from these various processes are integrated.
A comprehensive program description includes the following components:
- Need. What is the big public health problem you aim to address with your program?
- Targets. Which groups or organizations need to change or take action to make progress on the public health problem?
- Outcomes. How and in what way do these targets need to change? What action specifically do they need to take?
- Activities. What will your program and its staff do to move these target groups to change/take action?
- Outputs. What tangible capacities or products will be produced by your program’s activities?
- Resources/Inputs. What is needed from the larger environment in order for the activities to be mounted successfully?
- Relationship of Activities and Outcomes. Which activities are being implemented to produce progress on which outcomes?
In addition to specifying these components, a complete program description includes discussion of:
- Stage of Development. Is the program just getting started, is it in the implementation stage, or has it been underway for a significant period of time?
- Context. What factors and trends in the larger environment may influence program success or failure?
Matching Terms from Planning and Evaluation
Planning and evaluation are companion processes. Unfortunately, they tend to use different terms to express similar concepts. This may get confusing and lead to less integration of insights from planning and evaluation than is desirable. As noted in the figure below, plans tend to work from abstract/conceptual goals, then specify the more tangible objectives needed to reach them, and then the strategies needed to reach the objectives. These strategies may be specified as actions, tactics, or a host of other terms. The cross-walk from these planning components to the program description step in an evaluation is relatively straightforward. The strategies will provide insights on the program's activities, the objectives will likely indicate some of all of the target audiences and short-term or intermediate outcomes, and the goal is likely to be close to the long-term outcome desired by the program.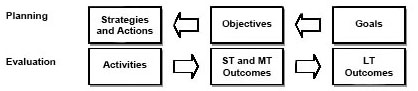
You need not start from scratch in defining the components of your program description. For example, a good source for generating a list of outcomes is the goals and objectives that may already exist for the program in its mission, vision, or strategic plan (see text box). The specific objectives outlined in documents like Healthy People 2010 are another starting point for defining some components of the program description for public health efforts (see http://www.health.gov/healthypeople).
![]()
Illustrating Program Descriptions
Let’s use some of our cases to illustrate the components of a program description.
Need for the Program
The need is the public health or other problem addressed by the program. You might define the need in terms of its consequences for the state or community, the size of the problem overall, the size of the problem in various segments of the population, and/or significant changes or trends in incidence or prevalence.
For example, the problem addressed by the affordable housing program is compromised life outcomes for low-income families due to lack of stability and quality of housing environments. The problem need for the Childhood Lead Poisoning Prevention (CLPP) program is halting the developmental slide that occurs in children with elevated blood-lead levels (EBLL).
Target Groups
Target groups are the various audiences that the program needs to move into action in order to make progress on the public health problem. For the affordable housing program, action of some kind needs to be taken by eligible families, volunteers, and funders/sponsors. For the CLPP program, reducing EBLL requires some action by families, healthcare providers, and housing officials, among others.
Outcomes
Outcomes (26) are the changes in someone or something (other than the program and its staff) that you hope will result from your program’s activities. For programs dealing with large and complex public health problems, the ultimate outcome is often an ambitious and long-term one, such as eliminating the problem or condition altogether or improving the quality of life of people already affected. Hence, a strong program description usually provides details not only on the intended long-term outcomes but on the short-term and intermediate outcomes that precede it and the sequence in which they are likely to occur.
![]()
Hierarchy of Effects

The text box "A Potential Hierarchy of Effects" outlines a potential sequence for a program’s outcomes (effects). Starting at the base of the hierarchy: Program activities aim to obtain participation among targeted communities. Participants’ reactions to program activities affect their learning—their knowledge, opinions, skills, and aspirations. Through this learning process, people and organizations take actions that result in a change in social, behavioral, and/or environmental condition that directs the long-term health outcomes of the community.
In thinking about this hierarchy or any sequence of outcomes, keep in mind that the higher order outcomes are usually the “real” reasons the program was created, even though the costs and difficulty of collecting evidence increase as you move up the hierarchy. Evaluations are strengthened by showing evidence at several levels of hierarchy; information from the lower levels helps to explain results at the upper levels, which are longer term.
The sequence of outcomes for the affordable housing program is relatively simple: Families, sponsors, and volunteers must be engaged and work together for several weeks to complete the house, then the sponsor must sell the house to the family, and then the family must maintain the house payments. For the CLPP program, there are streams of outcomes for each of the target groups: Providers must be willing to test, treat, and refer EBLL children. Housing officials must be willing to clean up houses that have lead paint, and families must be willing to get children and houses screened, adopt modest changes in housekeeping behavior, and adhere to any treatment schedule to reduce EBLL in children. Together, these ensure higher order outcomes related to reducing the EBLL and arresting the developmental slide.
Activities
These are the actual actions mounted by the program and its staff to achieve the desired outcomes in the target groups. Obviously, activities will vary with the program. Some typical program activities may include, among others, outreach, training, funding, service delivery, collaborations and partnerships, and health communication. For example, the affordable housing program must recruit, engage, and train the families, sponsors, and volunteers, and also oversee construction and handle the mechanics of home sale. The CLPP program does outreach and screening of children, and, for those children with EBLL, does case management, referral to medical care, assessment of the home, and referral of lead-contaminated homes for cleanup.
Outputs
Outputs are the direct products of activities, usually some sort of tangible deliverable produced as a result of the activities. Outputs can be viewed as activities redefined in tangible or countable terms. For example, the affordable housing program’s activities of engaging volunteers, recruiting sponsors, and selecting families have the corresponding outputs: number of volunteers engaged, number of sponsors recruited and committed, and number and types of families selected. The CLPP activities of screening, assessing houses, and referring children and houses would each have a corresponding output: the number of children screened and referred, and the number of houses assessed and referred. (27)
Resources/Inputs
These are the people, money, and information needed—usually from others outside the program—to mount program activities effectively. It is important to include inputs in the program description because accountability for resources to funders and stakeholders is often a focus of evaluation. Just as important, the list of inputs is a reminder of the type and level of resources on which the program is dependent. If, in fact, intended outcomes are not being achieved, the resources/inputs list reminds you to look there for one reason that program activities could not be implemented as intended.
In the affordable housing program, for example, a supply of supervisory staff, community relationships, land, and warehouse are all necessary inputs to activities. For the CLPP program, funds, legal authority to screen children and houses, trained staff, and relationships with organizations responsible for the activities that the program cannot undertake—in this case, medical treatment and clean-up of homes—are necessary inputs to mount a successful CLPP program.
Stages of Development
Programs can be roughly classed into three stages of development: planning, implementation, and maintenance/outcomes achievement. As will be seen, the stage of development plays a central role in setting a realistic evaluation focus in the next step. A program in the planning stage will focus its evaluation on a very different part of the program than will a program that has been in existence for several years.
For example, both the affordable housing and CLPP programs have been in existence for several years and can be classed in the maintenance/outcomes achievement stage. Therefore, an evaluation of these programs would probably focus on the degree to which outcomes have been achieved and the factors facilitating or hindering the achievement of outcomes.
Context
The context is the larger environment in which the program is immersed. Because external factors can present both opportunities and roadblocks, you should be aware of and understand them. Program context includes politics, funding, interagency support, competing organizations, competing interests, social and economic conditions, and history (of the program, agency, and past collaborations).
For the affordable housing program, some contextual issues are the widespread beliefs in the power of home ownership and in community-wide person-to-person contact as the best ways to transform lives. At the same time, gentrification in low-income neighborhood drives real estate prices up, which can make some areas unaffordable for the program. And some communities, while approving of affordable housing in principle, may resist construction of these homes in their neighborhood. For the CLPP program, some contextual issues include increasing demands on the time and attention of primary healthcare providers, the concentration of EBLL children in low-income and minority neighborhoods, and increasing demands on housing authorities to ameliorate environmental risks.
A realistic and responsive evaluation will be sensitive to a broad range of potential influences on the program. An understanding of the context also lets users interpret findings accurately and assess the findings’ generalizability. For example, the affordable housing program might be successful in a small town, but may not work in an inner-city neighborhood without some adaptation.
![]()
Relating Activities and Outcomes: Developing and Using Logic Models
Once the components of the program description have been identified, a visual depiction is often a helpful way to summarize the relationship among any or all of the components. This clarity can help with both strategic planning and program evaluation. While there are other ways to depict these relationships, logic models are a common tool employed by evaluators and the tool described most completely in the CDC Framework.
Logic models are graphic depictions of the relationship between a program’s activities and its intended outcomes. Two words in this definition bear emphasizing:
- Relationship: Logic models convey not only the activities that comprise the program and the inter-relationship of those activities, but the link between those components and outcomes.
- Intended: Logic models depict “intended” outcomes of a program’s activities, rather than reality at any point in time. As the starting point for evaluation and planning, the model serves as an “outcomes roadmap” that shows the underlying logic behind the program, i.e., why it should work. That is, of all activities that could have been undertaken to address this problem, these activities are chosen because, if implemented as intended, they should lead to the outcomes depicted. Over time, evaluation, research, and day-to-day experience will deepen the understanding of what does and does not work, and the model will change accordingly.
Other Names in a Logic Model
- Theory of change
- Model of change
- Theoretical underpinning
- Causal chain
- Weight-of-evidence model
- Roadmap
- Conceptual map
- Blueprint
- Rationale
- Program theory
- Program hypothesis
The logic model requires no new thinking about the program; rather, it converts the raw material generated in the program description into a picture of the program. The remainder of this chapter provides the steps in constructing and elaborating simple logic models. The next chapter, Focus the Evaluation Design, shows how to use the model to identify and address issues of evaluation focus and design.
Constructing Simple Logic Models
A useful logic model can be constructed in a few simple steps, as shown here using the CLPP program for illustration.
Develop a list of activities and intended outcomes. While logic models can include all of the components in the text box, we will emphasize using logic models to gain clarity on the relationship between the program’s activities and its outcomes. There are many ways to develop a list of activities and outcomes that you will incorporate into your model, and indeed you may already have a comprehensive list from the program description. But, to stimulate the creation of a comprehensive list, any of the following methods will work.
- Review any information available on the program—whether from mission/vision statements, strategic plans, or key informants— and extract items that meet the definition of activity (something the program and its staff does) and of outcome (some change in someone or something, other than the program and its staff, that you hope will result from the activities), or
- Work backward from outcomes. This is called “reverse logic” logic modeling and may prove helpful when a program is given responsibility for a new or large problem or is just getting started. There may be clarity about the “big change” (most distal outcome) the program is to produce, but little else. Working backward from the distal outcome by asking “how to” will help identify the factors, variables, and actors that will be involved in producing change, or
- Work forward from activities. This is called “forward logic” logic modeling and is helpful when there is clarity about activities but not about why they are part of the program. Moving forward from activities to intended outcomes by asking, “So then what happens?” is often helpful in elaborating downstream outcomes of the activities.
Logic models may depict all or only some of the elements of program description (see above text box), depending on the use to which the model is being put. For example, Exhibit 2.1, below, is a simple, generic logic model. If relevant to the intended use, the model could include references to the remaining components of program description, such as “context” or “stage of development.” Likewise, some of the examples presented below focus mainly on the connection of a program’s activities to its sequence of outcomes. Adding “inputs” and explicit “outputs” to these examples would be a simple matter if needed.

Note that Worksheet 2A at the end of this chapter provides a simple format for doing this categorization of activities and outcomes, no matter what method is used. Here, for the CLPP, we completed the worksheet using the first method.
![]()
CLPP Program: Listing Activities and Outcomes
Activities
- Outreach
- Screening
- Case management
- Referral to medical treatment
- Identification of EBLL children
- Environmental assessment
- Environmental referral
- Family training
Outcomes
- Lead source identified
- Families adopt in-home techniques
- EBLL children get medical treatment
- Lead source gets eliminated
- EBLL reduced
- Developmental "slide" stopped
- Quality of Life (Q of L) improved
Subdivide the lists to show the logical sequencing among activities and among outcomes. Logic models provide clarity on the order in which activities and outcomes are expected to occur. To help provide that clarity, it is useful to take the single column of activities (or outcomes) developed in the last step, and then distribute them across two or more columns to show the logical sequencing. The logical sequencing may be the same as the time sequence, but not always. Rather, the logical sequence says, “Before this activity (or outcome) can occur, this other one has to be in place.”
For example, if the list of activities includes a needs assessment, distribution of a survey, and development of a survey, most would conclude that the needs assessment of content should occur first, and that the distribution of a survey must be preceded by development of the survey. Likewise, among the outcomes, most would generally concede that change in knowledge and attitudes would precede change in behavior.
Worksheet 2B provides a simple format for expanding the initial two-column table. For the CLPP, we expanded the initial two-column table to four columns. Note that no activities or outcomes have been added. But the original lists have been spread over several columns to reflect the logical sequencing. For the activities, we suggest that outreach, screening, and identification of EBLL children need to occur in order to case manage, assess the houses, and refer the children and their houses to follow-up. On the outcomes side, we suggest that outcomes such as receipt of medical treatment, clean-up of the house, and adoption of housekeeping changes must precede reduction in EBLL and elimination of the resultant slide in development and quality of life.
![]()
CLPP Program: Listing Activities and Outcomes
Early Activities
- Outreach
- Screening
- Identification of EBLL children
Later Activities
- Case management
- Referral to medical treatment
- Environmental assessment
- Environmental referral
- Family training
Early Outcomes
- Lead source identified
- Lead source gets eliminated
- Families adopt in-home techniques
- EBLL children get medical treatment
Later Outcomes
- EBLL reduced
- Developmental “slide” stopped
- Q of L improved
Add any inputs and outputs. At this point, you may decide that the four-column logic model adds all the clarity that is needed. If not, the next step is often to add columns for inputs and for outputs. The inputs are inserted to the left of the activities while the outputs—as products of the activities—are inserted to the right of the activities but before the outcomes.
For the CLPP, we can easily define and insert both inputs and outputs of our efforts. Note that the outputs are the products of our activities, but do not confuse them with outcomes. No one has changed yet; while we have identified a pool of leaded houses and referred a pool of EBLL children, the houses have not been cleaned up, nor have the children been treated yet.
![]()
CLPP Program: Listing Activities and Outcomes
Inputs
- Trained staff for screening and clean-up
- Relationships with organizations
- Legal authority
Early Activities
- Outreach
- Screening
- Identification of EBLL children
Later Activities
- Case management
- Referral to medical treatment
- Environmental assessment
- Environmental referral
- Family training
Outputs
- Pool (#) of eligible children
- Pool (#) of screened children
- Referrals (#) to medical treatment
- Pool (#) of “leaded” homes
- Referrals (#) for clean-up
Early Outcomes
- Lead source identified
- Lead source gets eliminated
- Families adopt in-home techniques
- EBLL children get medical treatment
Later Outcomes
- EBLL reduced
- Developmental “slide” stopped
- Q of L improved
Draw arrows to depict intended causal relationships. The multi-column table of inputs, activities, outputs, and outcomes that has been developed so far may contain enough detail, depending on the purposes for which the model will be used. In fact, for conveying in a global way the components of a program, it almost certainly will suffice. However, when the model is used to set the stage for planning and evaluation discussions, the logic model will benefit from adding arrows that show the causal relationships among activities and outcomes. These arrows may depict a variety of relationships: from one activity to another, when the first activity exists mainly to feed later activities; from an activity to an outcome, where the activity is intended to produce a change in someone or something other than the program; from an early outcome to a later one, when the early outcome is necessary to achieve the more distal outcome.
Examine the CLPP Logic Model (Exhibit 2.2) with causal arrows included. Note that no activities/outputs or outcomes have been added. Instead, arrows were added to show the relationships among activities and outcomes. Note also that streams of activities exist concurrently to produce cleaned-up houses, medically “cured” children, and trained and active households/families. It is the combination of these three streams that produces reductions in EBLL, which is the platform for stopping the developmental slide and improving the quality of life.

Clean up the logic model. Early versions are likely to be sloppy, and a nice, clean one that is intelligible to others often takes several tries.
Elaborate the Simple Model
Logic models are a picture depicting your “program theory”—why should your program work? The simple logic models developed in these few steps may work fine for that purpose, but often programs benefit from elaborating their simple logic models in some of the following ways:
-
Elaborating distal outcomes: Sometimes the simple model will end with the short-term outcomes or even outputs. While this may reflect a program’s mission, usually the program has been created to contribute to some larger purpose, and depicting this in the model leads to more productive strategic planning discussions later. This elaboration is accomplished by asking “so then what happens?” of the last outcome depicted in the simple model, and then continuing to ask that of all subsequent outcomes until more distal ones are included.
For example, in Exhibit 2.3, the very simple logic model that might result from a review of the narrative about the home ownership program is elaborated by asking, “So then what happens?” Note that the original five-box model remains as the core of the elaborated model, but the intended outcomes now include a stream of more distal outcomes for both the new home-owning families and also for the communities in which houses are built. As will be discussed later, the elaborated model can motivate the organization to think more ambitiously about intended outcomes and whether the right activities are in place to produce them.
- Elaborating intermediate outcomes: Sometimes the initial model presents the program’s activities and its most distal outcome in detail, but with scant information on how the activities are to produce the outcomes. In this case, the goal of elaboration is to better depict the program logic that links activities to the distal outcomes. Providing such a step-by-step roadmap to a distal destination helps with some or all of the following: identify gaps in program logic that might not otherwise be apparent; persuade skeptics that progress is being made in the right direction, even if the destination has not yet been reached; aid program managers in identifying what needs to be emphasized right now and/or what can be done to accelerate progress.
For example, the mission of many CDC programs can be displayed as a simple logic model that shows key clusters of program activities and the key intended changes in a health outcome(s) (Exhibit 2.4). The process of elaboration leads to the more detailed depiction of how the same activities produce the major distal outcome, i.e., the milestones along the way.


Setting the Appropriate Level of Detail
Logic models can be broad or specific. The level of detail depends on the use to which the model is being put and the main audience for the model. A global model works best for stakeholders such as funders and authorizers, but program staff may need a more detailed model that reflects day-to-day activities and causal relationships.
When programs need both global and specific logic models, it is helpful to develop a global model first. The detailed models can be seen as more specific “magnification” of parts of the program. As in geographic mapping programs such as Mapquest, the user can “zoom in” or “zoom out” on an underlying map. The family of related models ensures that all players are operating from a common frame of reference. Even when some staff members are dealing with a discrete part of the program, they are cognizant of where their part fits into the larger picture.
The provider immunization program is a good example of “zooming in” on portions of a more global model. The first logic model (Exhibit 2.5) is a global one depicting all the activities and outcomes, but highlighting the sequence from training activities to intended outcomes of training. The second logic model magnifies this stream only, indicating some more detail related to implementation of training activities.


Applying Standards
As in the previous step, you can assure that the evaluation is a quality one by testing your approach against some or all of the four evaluation standards. The two standards that apply most directly to Step 2: Describe the Program are accuracy and propriety. The questions presented in the following table can help you produce the best program description.
Standards for Step 2 - Describe the Program
| Standard | Questions |
|---|---|
| Utility |
|
| Feasibility |
|
| Propriety |
|
| Accuracy |
|
![]()
Checklist for Describing the Program
__ Compile a comprehensive program description including need, targets, outcomes, activities, and resources.
__ Identify the stage of development and context of the program.
__ Convert inputs, activities, outputs, and outcomes into a simple global logic model.
__ Elaborate the model as needed.
__ Develop more detailed models from the global model as needed.
Worksheet 2A Raw Material for Your Logic Model
| Activities | Outcomes |
|---|---|
| What will the program and its staff actually do? | What changes do we hope will result in someone or something other than the program and its staff? |
Worksheet 2B Sequencing Activities and Outcomes
- Early Activities
- Later Activities
- Early Outcomes
- Later Outcomes
![]()
Evaluating Appropriate Antibiotic Use Programs
Step 2: Describe the Program
The Need for Appropriate Antibiotic Use Programs
As described earlier, the description of the need for your program should explain the health problem addressed by your program. For appropriate antibiotic use programs, you should answer the following questions:
- Why is antibiotic resistance a health problem? What are the consequences of antibiotic resistance for the state or community?
- What is the size of the problem overall and in various segments of the population?
- What factors contribute to the problem of antibiotic resistance and inappropriate prescribing?
- Who are the target groups for your program?
- What changes or trends are occurring in antibiotic resistance and antibiotic prescribing?
Use local surveillance data when available to show rates of resistant bacteria in your state or community. CDC’s Active Bacterial Core surveillance (ABCs) collects and reports data from 10 states (CA, CO, CT, GA, MD, MN, NM, NY, OR, and TN), representing a study population of approximately 38.3 million.(28) This information is available at http://www.cdc.gov/ncidod/dbmd/abcs/. Check with your state and local health department for the availability of surveillance data in your area. You may also discuss the possibility of conducting surveillance of additional pathogens of interest with your local public health officials. Active, population-based surveillance is resource intensive and not a feasible option for many communities. Aggregating existing hospital antibiograms or cumulative susceptibility data from clinical labs and hospitals is a simpler, less expensive, and relatively accurate way to estimate local resistance rates of drug-resistant Streptococcus pneumoniae.(29) CDC is developing a surveillance manual to aid state and local health departments in their efforts to monitor resistant bacteria. Sections of this manual are available on-line at http://www.cdc.gov/DRSPSurveillanceToolKit/index.htm.
Rates of antibiotic prescribing can also be used to demonstrate the need for your program. Local prescribing rates and rates among various segments of the population are useful to document the need for interventions in your community. Prescribing rates can be analyzed and presented by diagnosis or by antibiotics prescribed to describe current or past inappropriate prescribing practices. Health plans are a rich source of data on antibiotic prescribing.
When possible, use local data on the determinants of inappropriate antibiotic use and inappropriate prescribing. This could include surveys or focus groups of providers assessing their knowledge of prescribing guidelines, prescribing practices, or perceived pressures to prescribe antibiotics. Surveys or focus groups of consumers assessing knowledge and attitudes surrounding antibiotic use or expectations for antibiotics could also help you describe the problem of inappropriate use in your community.
It is also important to look for disparities among specific populations or communities when discussing the need for your program. Higher rates of antibiotic use have been seen among whites as compared with other racial/ethnic groups, most likely due to their increased healthcare utilization.20 However, specific populations or communities may have particular risk factors for inappropriate antibiotic use. For example, while many immigrant populations have limited access to conventional medical care, some immigrant groups have easy access to antibiotics and other medicines imported from other countries. In addition, historically marginalized groups may view appropriate antibiotic use messages as attempts by the dominant culture to further restrict their access to care. In this case, information about knowledge and attitudes surrounding antibiotic use, access to antibiotics, and usual sources of medicines and health care would all contribute to a greater understanding of the need for your program and the development of appropriate interventions. Sources of data for these indicators include, but are not limited to, national and state surveys, regional or community surveys, case studies, expert panels, and stakeholder panels.
Program Activities
Given the number of options for activities to promote appropriate antibiotic use, it is helpful to mention some existing frameworks and guidelines that can be used to direct the selection of program activities. These include the idea of social ecology as a theoretical basis and a list of recommended components and strategies based on the results of successful efforts. Regardless of the activities selected, a good program description will explain the reason for choosing these activities and will list their intended outcomes.
CDC encourages state and local programs to adopt a social ecological framework when designing interventions to promote appropriate antibiotic use. The social ecological approach to health promotion recognizes the contributions of both individual influences (e.g., knowledge, attitudes, and skills) and social environmental influences (e.g., social norms and organizational policies and practices) on health behavior.(30,31,32) This approach integrates person-focused efforts to modify people’s health behavior with environment-focused interventions to increase support for behavior change in their physical and social surroundings.(33)
Appropriate antibiotic use programs designed with social ecology in mind would promote changes at both the individual and social environmental levels. Patient and provider education targets individual change in knowledge, attitudes, skills and behavior, or group changes (e.g., social norms). Organizational changes could include revising childcare or workplace policies that require antibiotic treatment before returning after a sickness, or managed care policies for prescribing and pricing of antibiotics.
Based on the results of published trials and extensive experience with other state and local efforts, CDC has some recommendations on components and strategies that appropriate antibiotic use programs might effectively utilize. These components and strategies, some examples of how they are being implemented, and their rationale are shown in Exhibit 2.6 directly below.
![]()
Exhibit 2.6: Recommended Appropriate Antibiotic Use Program Components and Strategies(34)
| Recommended Program Components/Strategies | Examples | Rationale |
|---|---|---|
| Form a coalition of diverse partners. | State and local health departments, health plans, professional provider organizations, medical schools, Parent Teacher Associations (PTAs), school nurses, childcare providers, pharmacies, pharmaceutical manufacturers, and healthcare purchasers. | Partners bring a variety of resources, including staff, time, funding, and knowledge of and access to the target population. Engaging a diverse group of partners can help build community support for the program and expand the program’s reach. |
| Target changes at multiple levels – individuals, groups, and organizations or institutions. | Patient and provider education targets changes in individuals (e.g., knowledge, attitudes, and behavior) and in groups (e.g., social norms). Organizational changes may include revising childcare policies excluding children who have not received antibiotics or workplace policies requiring antibiotic treatment before an employee can return to work. | Interventions focusing on individual change alone may promote a victim-blaming ideology and neglect the importance of social influences on health and disease.(35) |
| Educate providers | Distribution of guidelines; patient education materials; articles in local health journals; grand rounds, lectures, workshops and other CME events; physician-led “peer” education; prescribing rate feedback. | Declines in antibiotic prescribing associated with patient and provider education components were not seen with a limited patient education intervention.(36) |
| Educate patients | Posters and pamphlets in waiting rooms; household mailings to patients; “cold kits” containing over-the-counter remedies for symptomatic relief. | Physicians report parental pressure to prescribe antibiotics for their children.(37) In one survey, educating parents was cited by 78% of physician respondents as the single most important program for reducing inappropriate antibiotic use.(38) |
| Educate the public | CDC national media campaign materials Educational materials distributed in community settings (i.e., schools, day care, health fairs); TV, radio and newspaper coverage. CDC national media campaign materials and toolkit are available for use by local campaigns. | Multiple exposures to program messages are more likely to produce changes in knowledge, attitudes and behavior. Media efforts can help raise awareness and change community norms. National media efforts can build national agenda and create foundation for local efforts.(39) |
| Evaluate program efforts | Program evaluation of both process and outcome measures. | Program evaluation can be used to: monitor progress toward the program’s goals, demonstrate that a particular program or activity is effective, identify activities that are ineffective and learn how to improve programs, justify the need for further funding and support, and communicate with stakeholders.(40) |
![]()
Program Outcomes
Outcomes are the changes in someone or something (other than the program and its staff) that we hope will result from program activities. The goals and objectives for a program will help guide the determination of intended program outcomes. Programs can also look to national measures when selecting target outcomes for local programs. Both Healthy People 2010 and the Health Plan Employer Data and Information Set (HEDIS®), the performance measurement tool used by over 90 percent of the nation’s health plans, include measures on appropriate antibiotic use that can be used in evaluating local programs.
Healthy People 2010 includes two objectives that measure the appropriate use of antibiotics. The first objective measures the use of antibiotics for ear infections among children less than five years old, and the second objective measures the use of antibiotics for the common cold. See http://www.healthypeople.gov/ for more information.
CDC and the National Committee on Quality Assurance have written two pediatric and two adult measures for HEDIS®. The pediatric measures, which were incorporated into HEDIS® in 2004, assess the appropriate treatment of children who present with pharyngitis or upper respiratory infections. The pharyngitis measure calculates the proportion of children who are tested for group A strep before receiving antibiotics for sore throats. The upper respiratory tract measure looks at the proportion of children who do not receive an antibiotic for the common cold. The adult measures, which were incorporated into HEDIS® in 2006 and complement the pediatric measures, assess inappropriate antibiotic treatment of adults with acute bronchitis as well as outpatient utilization of antibiotic prescriptions. The acute bronchitis measure calculates the percentage of healthy adults 18–64 years of age with a diagnosis of acute bronchitis who were dispensed an antibiotic prescription on or three days after the episode date. This Effectiveness of Care process measure assesses if antibiotics were inappropriately prescribed for healthy adults with bronchitis. The outpatient utilization of antibiotic prescriptions measure, which is a Use of Services measure, summarizes the following data: total number of antibiotic prescriptions, average number of antibiotic prescriptions per member per year, total days supplied for all antibiotics, average number of days supplied per antibiotic prescription, average number of antibiotics per member per year and reported by drug class (for selected antibiotics of concern; for all other antibiotics), and percentage of antibiotics of concern of total antibiotic prescriptions (during the measurement year, stratified by age and gender, and reported for each product). See http://www.ncqa.org/tabid/62/Default.aspx (exit) for more information.
For appropriate antibiotic use, intended program outcomes typically include changes in the knowledge, attitudes, or behaviors of either patients, providers or the general public, depending on the focus of program activities. More specifically, patient education activities can aim to increase patients’ knowledge of appropriate antibiotic use messages, change their attitudes to support appropriate antibiotic use, decrease their likelihood of demanding antibiotics from their providers, or increase their adherence to antibiotics when prescribed. For providers, educational activities can aim to increase providers’ knowledge about appropriate prescribing, change their attitudes and norms to support appropriate prescribing, or increase appropriate prescribing behavior. In addition, program activities may target changes at the organizational level, such as policies at the workplace, in childcare settings, or in managed care organizations. In these cases, outcomes would include the implementation of policies that support appropriate prescribing.
These outcomes can be divided into short-term, intermediate, and long-term outcomes, depending on the relative length of time needed to achieve change. Changes in knowledge, attitudes, and skills are relatively easy to accomplish and are usually classified as short-term outcomes. Behavior changes, such as patient demand for antibiotics or provider adherence to prescribing guidelines, are more difficult to achieve and would be classified as either intermediate or long-term outcomes.
Logic Models
As described earlier, logic models are graphic depictions (i.e., pictures) of the relationship between a program’s activities and its intended effects. In addition to presenting a clear and succinct picture of the program components and their intended results, the program’s logic model is used in program evaluation to identify performance indicators and to help in the selection of the activities and outcomes that will be included in any given evaluation.
Two logic models are presented here as examples. The first of the following logic models depicts CDC’s Get Smart: Know When Antibiotics Work program activities at the national level (Exhibit 2.7). Providing funds and technical assistance for state and local programs is a key activity of CDC’s national program, and the relationship of this activity to other national activities and to their intended outcomes is shown here. State and local campaigns and their intended effects are further depicted in the second logic model (Exhibit 2.8).

![]()
Get Smart: Know When Antibiotics Work – National Activities
In this model, key inputs include staff, partners (including federal agencies, health departments, and other organizations), and funding, which allow the implementation of a variety of activities through the establishment and maintenance of partnerships.
Key activities of the national campaign are listed in this model, and the relationship between these activities and their intended effects is shown. Outcomes are grouped by their respective target audiences – patients/consumers, providers, or institutions/ organizations. For example, short-term outcomes for patients or consumers include increases in knowledge, perceived risk, communication skills, and the ability to manage infections. These in turn lead to intermediate outcomes of decreased demand for antibiotics, increased adherence to prescribed antibiotics, and decreased antibiotic use, which ultimately are expected to contribute to a reduction in the rate of rise of antibiotic resistance. Anticipated relationships between outcomes for different target audiences are also depicted here. For example, decreased inappropriate prescribing by providers is achieved not only through educating providers and subsequent increases in their knowledge and skills as might be expected, but also through educating patients and decreasing their demand for antibiotics, promoting the adoption of prescribing guidelines and curricula, and promoting the use of performance measures.

State and Local Appropriate Antibiotic Use Campaigns
This model provides more detail for the state and local activities referred to in the global model depicting Get Smart’s national activities. Key inputs include staff, partners, funding (including the Epidemiology and Laboratory Capacity cooperative agreements), as well as other health department resources, CDC technical support, and CDC national campaign resources.
This model is meant to generally illustrate the types of activities implemented and outcomes expected by state and local campaigns. Because program staff and coalitions develop and implement activities in response to local needs and resources, CDC expects these efforts to vary across communities. Typical activities for state and local campaigns are listed in this model, and again, outcomes are grouped by their respective target audiences – patients/consumers, providers, or institutions/organizations. Of course, actual outcomes will vary depending on the activities implemented.
While the “right” logic model will vary with each situation, as mentioned earlier, elaborating a simple logic model can prove useful in program planning or evaluation. A simple initial model detailing appropriate antibiotic use activities may only depict the program’s short-term outcomes. This type of model may adequately guide your work and much of your evaluation even though it does not show the ultimate goal of your program. For example, a simple logic model for a media campaign may show posters, brochures, and public service announcements leading to an increase in public knowledge and awareness about appropriate antibiotic use. Critics of this program may question whether changes in knowledge and awareness alone are a worthy goal. However, if you believe that these increases in knowledge and awareness will help to decrease patient demand for antibiotics and ultimately contribute to more appropriate prescribing (especially in conjunction with education for healthcare providers), including these more distal effects and the relationship between activities and effects will help to explain your choice of short-term outcomes as evaluation measures. In this way, if you are able to make a reasonable case for the relationship between activities and intended effects, you can justify using more proximal outcomes as measures of program success when the long-term outcomes are slow to change and/or difficult to measure.
![]()
Footnotes
- Program evaluation and planning are replete with terms that are used inconsistently. In this document, the term “outcomes” is used to refer to the intended changes that will result from the program. However, others may use different terms to refer to the early and late outcomes: results, impacts, and outcomes is a typical sequence.
- In trying to distinguish “outputs” from “outcomes,” remember that an outcome is a change in someone or something other than the program and its staff. But also remember that these definitions are guidelines and are not set in stone. Often, there are “gray areas” where something might be classified as an output by some programs and an outcome by others. For example, the number of trainees attending my program is an outcome in the sense that someone other than my program staff—the trainee—took an intentional action (attending the training), but many might classify this an output—number of trainees attending—since there really has not been a change in the trainee.
- Centers for Disease Control and Prevention. Division of Bacterial and Mycotic Diseases. Active Bacterial Core Surveillance. 2004 Protocol for Active Bacterial Core Surveillance (ABCs) for the Emerging Infection Program Sites. Updated February 2004.
- Van Beneden CA, Lexau C, Baughman W, et al: Aggregated antibiograms and monitoring of drug-resistant Streptococcus pneumoniae. Emerging Infectious Diseases 2003;9(9):1089-1095.
- McLeroy KR, Bibeau D, Steckler A, et al: An ecological perspective on health promotion programs. Health Education Quarterly 1988;15(4):351-377.
- Green, LW, Richard, L, Potvin, L: Ecological foundations of health promotion. American Journal of Health Promotion 1996;10(4):270-281.
- Corbett, KK: Susceptibility of youth to tobacco: a social ecological framework for prevention. Respiration Physiology 2001;128:103-118.
- Stokols, D: Translating social ecological theory into guidelines for community health promotion. American Journal of Health Promotion 1996;10(4):282-298.
- Weissman J, Besser RE: Promoting appropriate antibiotic use for pediatric patients: a social ecological framework. Seminars in Pediatric Infectious Disease 2004;15(1):41-51.
- McLeroy KR, Bibeau D, Steckler A, et al: An ecological perspective on health promotion programs. Health Education Quarterly 1988;15(4):351-377.
- Gonzales R, Steiner JF, Lum A, et al: Decreasing antibiotic use in ambulatory practice: impact of a multidimensional intervention on the treatment of uncomplicated acute bronchitis in adults. JAMA 281:1512-9, 1999.
- Barden LS, Dowell SF, Schwartz B, et al: Current attitudes regarding use of antimicrobial agents: Results from physicians’ and parents’ focus group discussions. Clinical Pediatrics 1988;37:665-672.
- Bauchner H, Pelton, SI, Klein, JO: Parents, physicians, and antibiotic use. Pediatrics 1999;103(2):395-401.
- Finnegan JR, Viswanath K: Communication theory and health behavior change: the media studies framework, in Glanz K, Lewis FM, Rimer BK (eds): Health Behavior and Health Education: Theory, Research, and Practice (ed 2). San Francisco, CA, Jossey-Bass Inc, 1999, pp 313-341.
- MacDonald G, Starr G, Schooley M, et al: Introduction to Program Evaluation for Comprehensive Tobacco Control Programs. Atlanta, GA, Centers for Disease Control and Prevention, 2001.
![]()
Previous Page Next Page: Step 3: Focus the Evaluation Design
Pages in This Report
![]() This symbol means you are leaving the CDC.gov Web site. For more information, please see CDC's Exit Notification and Disclaimer policy.
This symbol means you are leaving the CDC.gov Web site. For more information, please see CDC's Exit Notification and Disclaimer policy.
File Formats: All viewers, players, and plug-ins used on this site can be downloaded from the file formats page. (For example: Adobe Acrobat Reader for pdf files, Windows Media Player for audio and video files, PowerPoint Viewer for presentation slides, etc.)
Copyrighted images: Images on this website which are copyrighted were used with permission of the copyright holder and are not in the public domain. CDC has licensed these images for use in the materials provided on this website, and the materials in the form presented on this website may be used without seeking further permission. Any other use of copyrighted images requires permission from the copyright holder.
Contact Us:
- Centers for Disease Control and Prevention
1600 Clifton Rd
Atlanta, GA 30333 - 800-CDC-INFO
(800-232-4636)
TTY: (888) 232-6348 - New Hours of Operation
8am-8pm ET/Monday-Friday
Closed Holidays - cdcinfo@cdc.gov
