Pedestrian Safety: Fact sheet
How big is the problem?
In 2008, 4,378 pedestrians were killed in traffic crashes in the United States, and another 69,000 pedestrians were injured. This averages one crash-related pedestrian death every 2 hours, and a pedestrian injury every 8 minutes. 1 Pedestrians are 1.5 times more likely than passenger vehicle occupants to be killed in a car crash on each trip.2
Who is most at risk?
- Older adults
Pedestrians ages 65 and older accounted for 18%of all pedestrian deaths and an estimated 10%of all pedestrians injured in 2008. 1 - Children
In 2008, one in every five children between the ages of 5 and 9 who were killed in traffic crashes was a pedestrian. 1 - Drivers and pedestrians who are alcohol-impaired
Alcohol-impairment—either for the driver or for the pedestrian—was reported in 48 percent of the traffic crashes that resulted in pedestrian death. Of the pedestrians involved, 36 percent had a blood alcohol concentration (BAC) above the illegal limit of .08 grams per deciliter (g/dL) or higher. 1
Additionally, higher vehicle speeds increase both the likelihood of a pedestrian being struck by a car and the severity of injury.3 In addition, most pedestrian and bicyclist deaths occur in urban areas, non-intersection locations, and at night. 1
How can pedestrians help prevent injuries and death from motor vehicle crashes?
- Pedestrians should be especially careful at intersections, where drivers may fail to yield the right-of-way to pedestrians while turning onto another street. 1
- Pedestrians should increase their visibility at night by carrying a flashlight when walking and by wearing retro-reflective clothing. 1
- Whenever possible, pedestrians should cross the street at a designated crosswalk. It is much safer to walk on a sidewalk, but if pedestrians must walk in the street, they should walk facing traffic. 1
What are CDC’s research and program activities in this area?
Why don’t more children walk to school?
CDC researchers conducted a nationally representative, random-digit-dialed telephone survey among English and Spanish-speaking adults, ages 18 and older. Respondents with at least one child (5-14 years) living in the household were asked about the child’s mode of travel to school. Respondents who reported that the child walked to school less than 4 days per week were asked to identify the primary barrier to walking more often. The most common mode of travel to school was the family car (46%), followed by school bus (40%), and walking (14%). Among those who did not usually walk to school, distance (70.7%) was the most common barrier, followed by traffic danger (9%). Children in the South were less likely to walk to school than children in other regions (Northeast, North Central, West). Distance to school was more commonly cited as a barrier to walking for older children than younger children. Efforts to promote walking to school may achieve better near-term success if focused on students who already live close to school.
- Related article
Beck LF, Greenspan AI. Special Report from the CDC: Why don’t more children walk to school? Journal of Safety Research 2008;39:449–452
Older adult pedestrian Injuries in the United States: causes and contributing circumstances
CDC researchers conducted an analysis of six years of data to examine the characteristics and contributing circumstances of nonfatal older adult pedestrian injuries. Data from the National Electronic Injury Surveillance System—All Injury Program (NEISS-AIP) were analyzed to gather more information about adults ages 65 and older who were non-fatally injured on a public roadway from 2001 to 2006. Findings showed that, on average, an estimated 52,482 older adults were treated in emergency departments each year for non-fatal pedestrian injuries. The majority (92.5%) of these injuries were the result of an older adult falling and being hit by a motor vehicle. More than 9,000 older pedestrian fall-related injuries each year involved a curb—such as an older adult tripping on a curb. While the growth of the older adult population may add to the overall burden of these non-fatal pedestrian injuries, making transportation and mobility improvements—including environmental modifications—can help prevent them. Findings of this study have not yet been published.
- Related article:
(In press)
Pedestrian fatalities, Atlanta Metropolitan Statistical Area and United States, 2000–2004
Motor vehicle crashes killed almost 5,000 pedestrians in 2005 in the United States. Pedestrian risk may be higher in areas characterized by urban sprawl. From 2000 to 2004, pedestrian fatality rates declined in the United States, but the Atlanta metropolitan statistical area did not experience the same decline. Pedestrian fatality rates for males, Hispanics, and the 15–34 and 35–54 year age groups were higher in Atlanta than in the United States overall. Pedestrian safety interventions should be targeted to high-risk populations and localized pedestrian settings.
- Related article:
Beck LF, Paulozzi LJ, Davidson SC. Pedestrian fatalities, Atlanta Metropolitan Statistical Area and United States, 2000–2004. Journal of Safety Research 2007;38:613-616.
References
- Department of Transportation (US), National Highway Traffic Safety Administration (NHTSA). Traffic Safety Facts 2008: Pedestrians. Washington (DC): NHTSA; 2008 [cited 2010 May 19]. Available from URL: http://www-nrd.nhtsa.dot.gov/Pubs/811163.PDF.
- Beck LF, Dellinger AM, O’Neil ME. Motor vehicle crash injury rates by mode of travel, United States: Using exposure-based methods to quantify differences. American Journal of Epidemiology 2007;166:212–218.
- Rosen E, Sander U. Pedestrian fatality risk as a function of car impact speed. Acc Anal Prev 2009;41:536-542.
Additional Resources
- National Highway Traffic Safety Administration (NHTSA) Pedestrian Program
- Federal Highway Administration/ Safe Routes to School Program
- National Center for Safe Routes to School
- National Safe Kids Campaign
- Pedestrian and Bicycle Information Center
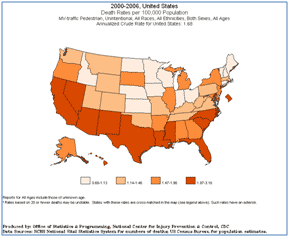
To see how your state’s pedestrian safety compares to other states, visit the new WISQARS Fatal Injury Mapping Module at http://wisqars.cdc.gov:8080/cdcMapFramework/mapModuleInterface.jsp
Get email updates
To receive email updates about this page, enter your email address:
Contact Us:
- Centers for Disease Control and Prevention
National Center for Injury Prevention and Control (NCIPC)
4770 Buford Hwy, NE
MS F-63
Atlanta, GA 30341-3717 - 800-CDC-INFO
(800-232-4636)
TTY: (888) 232-6348
New Hours of Operation:
8am-8pm ET/
Monday-Friday
Closed Holidays - cdcinfo@cdc.gov

