On this Page
- State-specific 2003, 2005, 2007 and 2009 BRFSS prevalence estimates
- Arthritis prevalence estimates by state
- Arthritis prevalence estimates in women and men by state
- Arthritis prevalence projections through 2030
- Prevalence of arthritis-attributable work limitation
- Prevalence of no leisure-time physical activity (LTPA)
- Proportion of arthritis-attributable work limitation
- Arthritis-Attributable activity limitations
- Proportion of arthritis-attributable activity limitations
- Proportion of arthritis-attributable social participation restriction
- Proportion of arthritis-attributable severe joint pain
- Gross domestic product (GDP) estimates
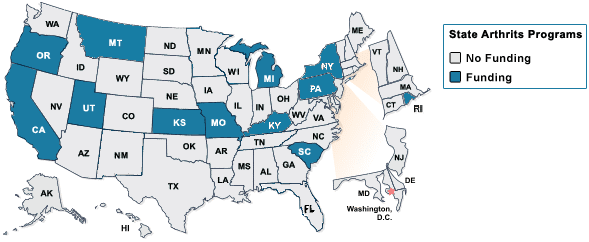
State Statistics
State-specific 2003, 2005, 2007 and 2009 BRFSS prevalence estimates
The Behavioral Risk Factor Surveillance System (BRFSS) is the best source for state-specific arthritis prevalence estimates. BRFSS is a state-based, random-digit-dialed telephone survey of the noninstitutionalized, civilian U.S. population ages ≥ 18 years. The survey is administered in all 50 states, the District of Columbia, Puerto Rico, Guam, and the Virgin Islands. Since 1996, selected states have been collecting information on arthritis through BRFSS.
Starting with the 2003 BRFSS and continuing in odd-numbered years, all states collected information on arthritis. Different questions were used to collect data between 1996–2001 and from 2002 forward. For this reason, it is not valid to look at trends that cross from 2001 into 2002. In 2002, the case definition of arthritis changed as well. Beginning in 2002 we have focused on doctor-diagnosed arthritis only. Read more about the BRFSS arthritis-specific questions and the arthritis case definitions.
View the summary of these state-specific ` by using the clickable map or the data list below:
Territorial Statistics
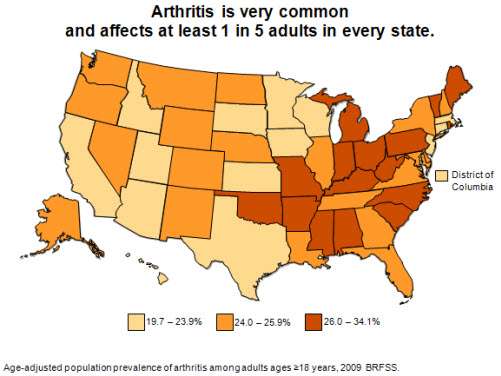
Arthritis prevalence estimates by state
State-level Behavioral Risk Factor Surveillance System 2009 prevalence estimates found that arthritis is reported by at least one in five adults in every state. Only fourteen states, plus the District of Columbia, were in the lowest prevalence group. In the 16 states with the highest prevalence, arthritis affects up to one in three adults.
[Text description is available.]
CDC unpublished data.
Data source: BRFSS 2009.
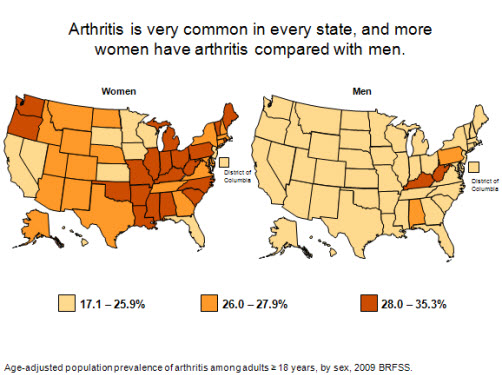
Arthritis prevalence estimates in women and men by state
State-level Behavioral Risk Factor Surveillance System 2009 prevalence estimates by sex found women reporting a higher prevalence of arthritis than men in every state. When examined by the same prevalence cutoff points (17.1–25.9%; 26.0–27.9%; and 28.0–35.3%), there were only two states in which both women and men were in the highest prevalence group (Kentucky and West Virginia). For the most part, women were in the middle and high prevalence group, but men were in the lowest prevalence group for all but four states. In the majority of jurisdictions (40 states and D.C.), at least one in every four women report arthritis.
[Text description is available.]
CDC unpublished data
Data Source: BRFSS 2009
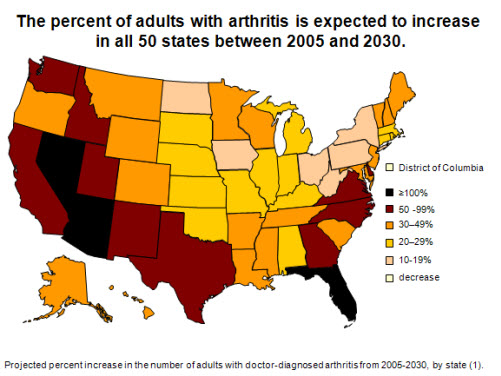
Arthritis prevalence projections through 2030
State-specific projections of arthritis prevalence from 2005 through 2030 show a substantial, average increase of 34% in all states. Ten states are anticipated to have increases from 50%–90%, and three states (Arizona, Florida, and Nevada) are projected to see their numbers more than double. Similar increases are projected for arthritis-attributable activity limitation. The biggest projected increases are expected to occur in the “sunbelt” and western states. These projections highlight the need for wider dissemination of existing evidence-based interventions and strategies that have been shown to decrease pain and increase function.
[Text description is available.] | A table offering more detailed state specific data is available.
Freedman M, Hootman JM, Helmick CG. Projected state-specific increases in self-reported doctor-diagnosed arthritis and arthritis-attributable activity limitations—United States, 2005–2030. MMWR 2007;56(7):423–425. errata html; html; pdf [528K]
Data Source: 2005 Behavioral Risk Factor surveillance system, U.S. Census bureau. http:/www.census.gov/population/www/projections/projectionsagesex.html
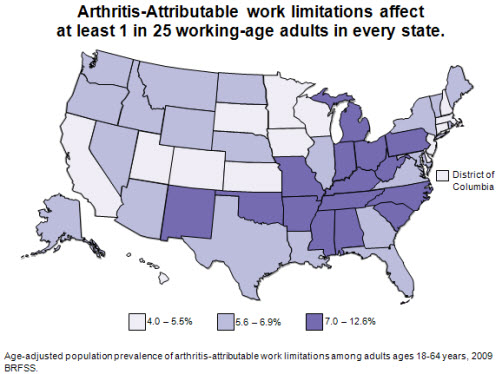
Prevalence of arthritis-attributable work limitation
In all states, working-age (ages 18-64) U.S. adults face work limitations they attribute to arthritis. The prevalence of arthritis-attributable work limitation varies by state but is generally high, affecting from 4.0% to 12.6% of all working-age adults. For example, a state with a population prevalence of arthritis-attributable work limitation of 7% could be expressed as: approximately 1 out of every 14 working-age adults in the state report doctor-diagnosed arthritis and say that it limits them in their work.
[Text description is available.]
CDC unpublished data
Data Source: BRFSS 2009
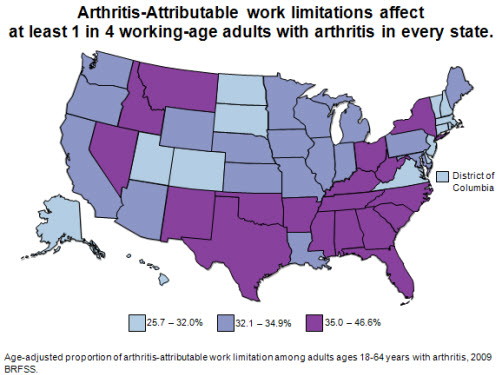
Proportion of arthritis-attributable work limitation
Arthritis-attributable work limitation is very common among working-age (ages 18-64) adults with arthritis. In states with the lowest prevalence of arthritis-attributable work limitations, it is still reported by greater than 1 of every 4 working-age adults with arthritis (25%). In states with the highest prevalence of arthritis-attributable work limitation, that ratio jumps to approximately 1 of every 2 working-age adults with arthritis.
[Text description is available.]
CDC unpublished data
Data Source: BRFSS 2009
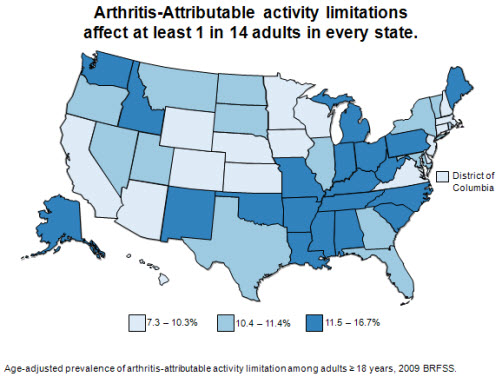
Arthritis-Attributable activity limitations
The prevalence of adults with arthritis-attributable activity limitation ranges from 7.3% to 16.7%. These high rates of arthritis-attributable activity limitation are projected to increase with the aging of the population, requiring increased intervention measures to reduce this impact. Arthritis-attributable activity limitation can be prevented or reduced in many persons. In fact, both aerobic and strengthening exercises can improve physical function and self-reported arthritis disability. Self-management education classes can also increase confidence in one’s ability to manage arthritis.
[Text description is available.]
CDC unpublished data
Data Source: BRFSS 2009
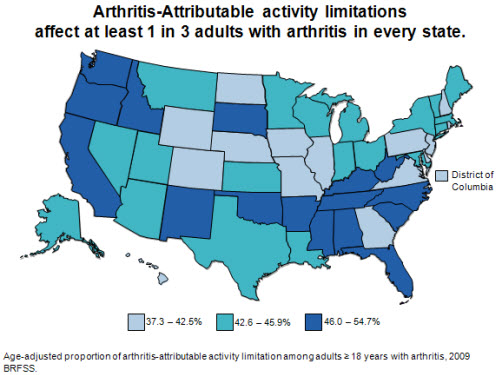
Proportion of arthritis-attributable activity limitations
The proportion of adults with arthritis who have arthritis-attributable activity limitations is substantial. In every state at least one in three adults with arthritis reports arthritis-attributable activity limitations. In some states, more than one in two adults reports arthritis-attributable activity limitations.
[Text description is available.]
CDC unpublished data
Data Source: BRFSS 2009
Proportion of arthritis-attributable social participation restriction
Arthritis-Attributable social participation restriction is defined here as an answer of “a lot” to a question asking how much arthritis has interfered with “normal social activities, such as going shopping, to the movies, or to religious or social gatherings.” The proportion of adults with arthritis-attributable social participation restriction ranges from about one in twelve to one in three adults across states, indicating that it is a substantial problem caused by arthritis.
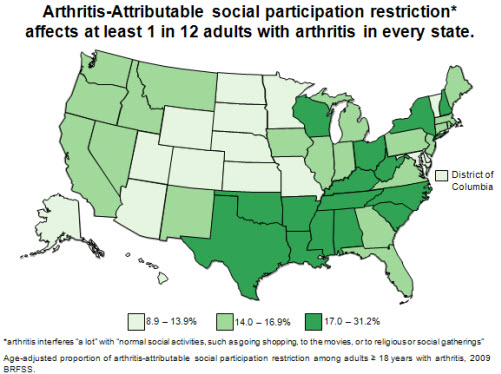
[Text description is available.]
CDC unpublished data
Data Source: BRFSS 2009
Proportion of arthritis-attributable severe joint pain
Pain is a common symptom of arthritis. Arthritis-Attributable severe joint pain is reported by at least one in seven adults with arthritis in every state. In states with the highest prevalence of arthritis-attributable severe joint pain, it is more common than every one in three adults with arthritis.
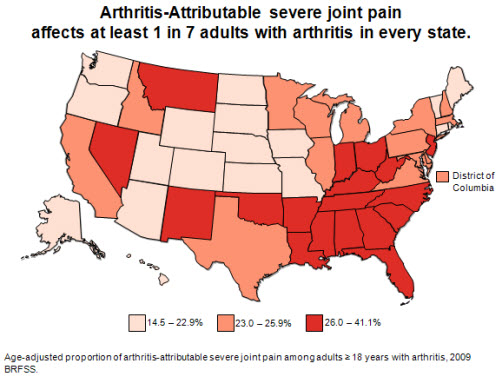
[Text description is available.]
CDC unpublished data
Data Source: BRFSS 2009
State-Specific Gross Domestic Product (GDP) Estimates
To demonstrate the economic impact of arthritis and other rheumatic conditions (AORC) in each state, this map shows the proportion of each state economy spent on AORC attributable costs relative to the economy of each state. In 2003, costs attributable to AORC represented between 0.3 to 2.6% of each state’s GDP. For example: in 2003, the costs attributable to AORC in West Virginia were $1.2 billion and this represented 2.6% of West Virginia’s GDP.
[Text description is available.]
Murphy L, Cisternas M, Yelin E, Trupin L, Helmick C. Update: Direct and indirect costs of arthritis and other rheumatic conditions—United States, 1997. MMWR 2004;53(18):388–389. html; pdf [273K]
Data Source: Medical Expenditure Panel Survey (MEPS) 2003 and BRFSS 2003
Prevalence of no leisure-time physical activity (LTPA)
In every state, adults with arthritis have significantly higher prevalence of no leisure-time physical activity (LTPA) compared with adults without arthritis. In 23 states, the prevalence of no LTPA among adults with arthritis is particularly high (≥30%). Adults with arthritis comprise a large proportion (≥33%) of all adults reporting no LTPA in every state.
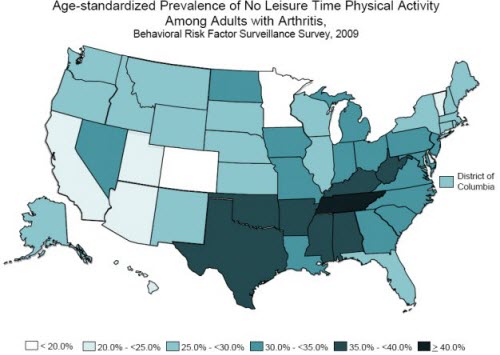
A table offering more detailed state specific data is available.
Hootman JM, Barbour KE, Watson KB, Harris C. State-specific prevalence of no leisure-time physical activity among adults with and without doctor-diagnosed arthritis—United States, 2009. MMWR. 2011; 60(48):1641-1645. html pdf [1.10MB]
Data Source: BRFSS 2009
Get email updates
To receive email updates about this page, enter your email address:

Contact Us:
- Arthritis Program
Mailstop K-51
4770 Buford Hwy NE
Atlanta, GA 30341-3724
- Phone: 770.488.5464
Fax: 770.488.5964 - cdcinfo@cdc.gov
